Sunday, February 03, 2008

A study conducted in line at the supermarket


In this blog's brief life, the most frequented post by far addressed the question of whether black men prefer white women. My tentative conclusion was that they like light-skinned blacks with European-ish features, but I haven't run across the data to test the idea.

Standing in line at the supermarket last night, I opened the latest issue of Ebony which featured an article on "Who is Dating Who?" [sic]. The magazine also featured other famous couples. I counted 19 couples, and the darkest, most African looking women by a wide margin was Mrs. Barack Obama shown in the top photo. (Evidently, Barry wanted to prove he was black enough when he chose Michelle). She really was an outlier.

Much more common were women like Porschla Coleman who is dating Russell Simmons (shown in the bottom photo). So, my second (unscientific) stab at the same question produces the same results.

This pattern is consistent with my tastes, by the way, only in the reverse direction. Lighter white women can be beautiful, indeed, but beautiful like a painting. It's the darker white women who really stir the blood, as if a little dose of the exotic is necessary. There were few black men with pasty girlfriends. Too much exotic can turn someone off.

Saturday, February 02, 2008

"Make it a Hunderd" McCain: Here on YouTube, in case there is any doubt, is John McCain saying that we've been in South Korea and Japan for decades, and it's perfectly fine with him if we stay in Iraq for 100 years.

How is it exactly that this guy is supposedly the most the most electable of the Republican bunch when the vast majority of Americans are turned off to the War, while this guy has a obvious hard-on for it (along with wanting to put troops anywhere around the world where there are bad guys)?

The Dems will successfully use this against him, and will portray him (accurately) as a scary warmonger.

I don't need to pursue reasons to not support McCain since there are people who can say it much better than I; namely, the one and only Pat Buchanan.

Thursday, January 31, 2008

It's a culture war: Discovering that income simply does not influence voting among immigrants (at least among non-whites) led me to wonder how much it influences native-born Americans. Put simply, it doesn't matter for them either. Looking at 2000 voting pattern, income had no predictive power once race was controlled. I hunted around for what is predictive--sex, education, marital status, number of children--and everything was weak except for race and a number of indicators of religious orientation: being Christian, religious, or fundamentalist. The simplest way for me to create polar opposites is to use black versus white along with fundamentalist versus no religion:


Percent who voted for Clinton in 1996

Fundamentalist whites 11.6
Blacks with no religion 96.6

Let me say it again: income predicts nothing. Pat Buchanan is right: it's a culture war. It ain't the rich against the poor. Immigrants pick up on this and regardless of income, if they're non-white or irreligious, they generally join up with the--what does O'Reilly call them--secular progressives. Those who loathe what white fundamentalists cherish: traditional Christianity, old-time values, and freedom.
To find a Republican Senator more liberal than McCain, you have to go to the--yuck--Northeast: The American Thinker analyzes numbers from the American Conservative Union to show that there are only three current Republican Senators more liberal than McCain--Collins (R-ME) Snowe (R-ME) and Specter (R-ME).
Two reasons--to start with--to oppose McCain: I plan to link to everything I come across showing that McCain is way too liberal for a conservative to vote for. Robert Novak documents that: 1) McCain thinks Alito is too conservative, and 2) he has told people that the next president may need to raise taxes.
Mitt and Mormonism: FINALLY, an intelligent piece on Mitt Romney and the Mormon Question, by Allan Wall at Vdare.com. Up until now, I've read almost nothing but hysterics and paranoia, even by otherwise thoughtful men like Thomas Fleming. The stupidity on the subject knows no bounds. Prior to this article, the only insightful writing I ran across was Razib's.

Wall expresses my concern that Mormons for doctrinal reasons tend to be soft on illegal and legal immigration, and while Mitt is clearly running to the right of McCain on the issue, his real views are probably influenced by his religious beliefs. Specifically, he is likely to have more-than-usual affection for Hispanics because of the Mormon belief that the indigenous people of the Western Hemisphere are sort of a chosen people. They have joined the Church in very large numbers (more than half of the membership worldwide is Spanish-speaking) and so white Mormons feel a kinship with them.

Wednesday, January 30, 2008

Race is the most powerful predictor of how immigrants will vote: I've shown in recent posts that neocons are flat wrong when they say that mass immigration is good for conservatism because immigrants move right after assimilating into American society. Non-white immigrants actually move left as they move up, as do those with no religion. The old belief that immigrants are an upwardly mobile bunch, and that people with increasing incomes become Republicans is false: 1) because the majority of folks from the largest immigrant group--Mexicans--as well as many from other groups do not become high-income, and 2) many immigrants are not white and not religious, and my analysis of GSS data has shown that these two groups become hardcore Democrats as their incomes rise.

One question I haven't answered is, which of these factors--income, religiosity, or race--is most important in determining whether immigrants vote for Republicans? Below, I show the results of a multivariate analysis. For race, I created a variable I called "social distance from white" where whites=1, other=2, and black=3.


Voted for Bush in 2000 (OLS standardized coefficients)

distance from whites -.294*
personal income .037
church attendance .171*
N = 129

* p < .05, one-tail test


Contrary to conventional wisdom, higher income immigrants are not more likely to vote Republican. Religious immigrants were more likely to vote for Bush, but the most powerful predictor is being white.

Based on this model, 69 percent of immigrants who are white and attend church more than weekly are predicted to vote for Bush; the percent for black immigrants who never go to church is 16 percent. For other non-whites who never attend church (e.g., Asians, Hispanics) 23 percent are expected to vote Republican.

The obvious implication for conservatives is that if they want to conserve themselves, they should favor one of the following: 1) an end to all immigration, 2) an increase in immigration among people who are white and religious, or 3) a reduction in the numbers of their counterparts (or 2 and 3 together).

Tuesday, January 29, 2008

High-income immigrants with no religion vote overwhelmingly for Democrats: I wrote in an earlier post that Christian immigrants are more likely to move right and vote Republican as they assimilate, compared to non-Christians. Let's see if data (from the General Social Survey) support me. The survey asked 118 immigrants how they voted in 2000 (that is a small sample size, so fair warning). Here are the results:


Percent who voted for Bush in 2000

Low-income
Christian 50.0
Non-Christian 38.9

High-income
Christian 70.6
Non-Christian 31.6

Christian immigrants start out split and move right as their incomes increase. Non-Christians, by contrast, start out liberal and move left as they move up.

But maybe it's simply religion, and not specifically Christianity:


Percent who voted for Bush in 2000

Low-income
Has a religion 50.0
No religion 35.7

High-income
Has a religion 64.0
No religion 18.2

So, it appears that people who are affiliated with any religion--not just Christians--move right as they assimilate--while immigrants with no religion move left. (This helps explain why Chinese and Japanese immigrants aren't conservative: 44% and 40%, respectively, belong to no church.)

Tying this in with earlier points, as the number of immigrants who are non-white or non-religious grows, Republicans lose support. Improving incomes does not fix the problem; it only gets worse. Upward mobility only moves immigrants to the right if they are white or belong to a church. Other immigrants may become wealthier, but they become even more turned off to Republicans. The idea that people vote with their wallets, and so immigration of the upwardly mobile is a long-term winner for conservatives, is simply false.

Friday, January 25, 2008


Which American ethnic group is most negative toward Jews? You're thinking Germans, right? Wrong! Don't you ever read this blog? If you did, you would know it's... Mexicans!

The General Social Survey asked 1,008 people about the contributions of Jews to American society. Here are the percentages who answered that they have contributed little that is positive:


Percent who say that Jews have contributed little to American society

Mexican 16.2
American Indian 14.0
Blacks 9.1
Italian 8.0

USA 5.8

Scottish 4.4
German 4.0
Irish 3.3
English/Welsh 3.3
Jewish 0.0

This is the second time I have analyzed data showing that Mex-Ams have the most negative attitudes toward Jews, so importing massive numbers of Mexican immigrants is likely to make the sentiment more widespread.

For fun (admittedly nerdy fun), let's see the numbers who answered that Jews have contributed more to America than any other ethnic group:


Percent who say that Jews have contributed the most to American society

Jewish 26.5
English/Welsh 14.6
Blacks 14.1

USA 12.1

Scottish 10.8
Mexican 10.8
German 10.3
Italian 10.0
Irish 9.9
American Indian 6.0

You Jewish folks are patting yourselves on the back here just a little, but not without reason. What do you think respondents were thinking of? Jonas Salk? Einstein? (I'm sure some would think he counts.) Abraham Lincolnowitz? Myself, I was thinking the Marx Brothers (see above).

By the way, these numbers support the idea that people of English descent are philosemitic.
Why upwardly mobile immigrants vote Democrat: I bet you can predict pretty accurately whether someone votes Democrat or not by knowing if he views himself as an outsider. The Democrat Party is the party of outsiders. The most Democratic voting bloc, blacks, see themselves as a marginalized group. Whites who loathe the idea of wearing a suit and tie are usually liberal voters. Many Jews still see themselves as outsiders (but that has a lot more to do with history than current realities). They vote 3 to 1 Democrat.

This is a serious problem when it comes to the issue of immigration. New immigrants are by definition outsiders. Moving to the inside--and I'm talking here about something psychological and not economic and social--is not easy for immigrants, especially if they are not white. As I have shown in recent posts, non-white immigrants move left as they move up economically and socially.

Someone who sees himself as an outsider also perceives himself as weak--the inside is where the power is. He naturally joins up with other self-perceived outsiders to play the role of David against Goliath. He is both insecure and morally superior at the same time. His stance is oppositional: he wants to tear down whatever it is that the giant wants to hold up. That role is a an alluring one, and the psychological payoff is large enough to keep its hold on a person, even after achieving economic success. The role is so appealing, the children of non-white immigrants are likely to adopt it, even though they were born here and may have enjoyed an easy life.

People on the Right, by contrast, have no such insecurities: they belong here and they know it. The guys in suits are not your enemies: you're on the same team. But it is much easier to get to that place psychologically if you are white and Christian.

I say Christian because I can think of two examples where it's not just about race. I mentioned already how many Jews see themselves as outsiders, even though they are white. I showed earlier that Filipino immigrants are one of the only groups to move right as they assimilate. That may very well be due to the fact that they are overwhelmingly Catholic (in addition to being economically successful).

My comments so far have focused on an individualistic orientation, which shows my Western bias. Non-white immigrants are probably more clan-oriented than their European counterparts, so they might simply vote Democrat because they are concerned about the ease with which family members and co-ethnics can move to America in the future, and the Democratic Party is reliably an open borders party. Clan loyalty for these folks trumps economic interest.

You might respond that if non-whites are less individualistic, perhaps that is the reason they move left after immigrating here. There are a couple problems with that idea. It might be able to explain why they arrive here more collectivist than the average American, but why would they move farther left as they assimilate? Second, they might be more clan-oriented than Europeans, but one wouldn't expect them to be more big government than European immigrants who come from countries more liberal than the U.S. And perhaps the most important item is the direction they move after they get here, regardless of their politics when they arrive. Non-whites move left as they move up; Europeans do not. Something about the experience here convinces successful non-whites that the Democrats better represent their interests, while high-income European immigrants do not feel the same way. Successful people from Europe appear to be focused on economic concerns like low taxes, while their non-white counterparts are insecure about their place here in America, and they worry about relatives and co-ethnics who might want to emigrate in the future.

Thursday, January 24, 2008

Which American ethnic group is proudest of their country? Probably English-Americans, right? Wrong! It's American Indians! The General Social Survey asked 1,195 people their primary ethnic group, and how proud they are of their country. Here are the percentages who answered "very proud":


Percent who are very proud of America

American Indian 92.2
Irish 87.1
German 83.5

All Americans 78.1

Italian 77.4
Mexican 75.9
English/Welsh 74.2
Jewish 67.7
Black 66.0

Blacks and American Indians have responded very differently to the injustices they have experienced. Not only are they on opposite poles here, blacks overwhelming vote Democrat, while Indians lean right. (In 2004, 50% voted for Bush).

No one can compete with the Indian number, but it is encouraging to see that Mex-Ams are prouder of their country than Americans of English ancestry. Jews are similar to blacks, but do not have the same kind of history here that would explain the low number. It is probably the case that more liberal groups accept the idea that it's unseemly to cheerlead too loudly about one's own country.

Wednesday, January 23, 2008

White ethnocentrism: I don't know why I didn't run across this article on the psychology of white ethnocentrism by Kevin MacDonald before now. I know he's controversial, but it was thought-provoking.

Monday, January 21, 2008

Do atheists believe in anything? Over at his blog, Steve Sailer quotes the notorious atheist Christopher Hitchens as believing that anyone who thinks that race is real is a racist. Steve then cites a G.K. Chesterton scholar who said that when a man stops believing in God, he doesn't believe in nothing, he believes in anything.

Having been both a believer and an atheist, I'm not sure if atheism is a sign that a person is unanchored and thereby vulnerable to kooky ideas, or just indicative of a person with a sharp BS detector.

Let's have the General Social Survey shed some light on the question. In 2006, 1,782 Americans were asked if they believed in God, and if they considered astrology to be scientific. Here are the answers:


Percent who think astrology is somewhat or very scientific

I don't believe in God 28.8
There is no way to know 22.3
There is some higher power 28.9
I believe sometimes 31.5
I believe but have doubts 31.8
I know God exists 34.3

Compared to people of faith, atheists are not more likely to believe in crackpot ideas (at least in the case of astrology). Agnostics, however, seem to have the most acute BS detectors. Some atheists may be the tough-minded type, while others may be the kind who grab onto just about any idea if it irks Mom and Dad (and respectable society).

Sunday, January 20, 2008

Hispanic teens are worse (at least with some behaviors) than blacks, Part II: I showed in an earlier analysis that, compared to blacks, Mexican-American teens have higher levels of truancy, marijuana and cocaine use, weapons carrying, bullying, and frequent fighting. I found a similar pattern looking at another national survey--Monitoring the Future. The sample is 3,180 high school seniors:


Percent who received traffic ticket after drinking--past year
Black 4.5
Hispanic 6.5

Percent who received traffic ticket after smoking marijuana--past year
Black 3.7
Hispanic 4.6

Skipped a whole day of school in past month
Black 30.6
Hispanic 35.6

Folks who claim that mass Mexican-American immigration improves our quality of life must never leave their Manhattan penthouses.

Myself, I got bored at Wal-Mart today while waiting for my car's oil to get changed. So I went to the huge magazine and book rack, and could not find one decent magazine to read. Roughly two-thirds of the customers are Latinos, and there was not a single news or political magazine except for one lonely Time review of 2007. There was one book on Che in Spanish, and I studied the language in college, but it is way too much of an effort. In fact, most of the books were in Spanish, and most of the others were self-help books, both religious and psychological. Yuck.

Since there was not a damn thing to read, I decided to count the ratio of Hispanic groups talking Spanish versus those speaking English that passed by. Thirty-four Spanish, eight English. Roughly 4 to 1. Mercifully, I was paged, I retrieved my car, flipped on the radio, and found an acceptable station out of the five that were in English. Don't imagine for a second that I would have found Placido Domingo if I had given the Spanish language stations a chance. I'm sure you wouldn't think that either unless you live in one of those penthouses.

Wednesday, January 16, 2008

If conservatives want to conserve themselves, they need to be against all immigration--or at least all non-white immigration: My last two post have shown that, contrary to neocon nonsense, immigrants move left as they move into mainstream American society. I have, however, focused on non-white (or mixed raced) immigrants, while white immigrants have been left out of the picture. Below I show the percent of immigrants who voted for Bush in 2000 by race and by various indicators of assimilation:


Percent who voted for Bush

White
Less than high school 44.4
High school 45.0
Junior college 76.5
Bachelors 56.7
Grad school 25.0

Non-white
Less than high school 35.0
High school 43.9
Junior college 33.3
Bachelors 27.3
Grad school 33.3

White
Low-income 50.0
High-income 60.0

Non-white
Low-income 28.1
High-income 37.5

White
Low-prestige job 49.3
High-prestige job 46.9

Non-white
Low-prestige job 31.9
High-prestige job 22.8

The differences are clear. While white immigrants appear to help Republicans to some degree, non-white immigrants, regardless of the ease to which they move to America's mainstream, push the country left. As white immigrants make more money, they become more conservative. So do non-whites, but 38% of high-income non-white immigrants voting for Bush is still a big loss to Republicans.

So the lesson here to conservatives is that if you want to ever win elections in the future, you had better shut down illegal and legal immigration--at least from non-white countries. Or just maintain the status quo, and allow neocons to eventually convince the country that universal health care is actually a conservative idea. Your choice.

Tuesday, January 15, 2008

Do immigrant groups move right as their income increases? In the last post, we saw that immigrants as a group move left, not right, as they become more educated, but a skeptic might argue that we need to look at income since education is a liberalizing experience. The problem with income is that that the sample size is smaller--especially for high-income individuals--so I have to merge all the groups from the last analysis (Chinese, Mexican, Filipino, Puerto Rican, West Indian, Asian Indian). Mexicans are perhaps large enough to show separately as well. "Low-income" is defined as a personal income under $50,000; "high-income" is $50,000 plus:


Percent who voted for Bush in 2000

All immigrant groups
low-income 45.5
high-income 30.8

Mexicans
low-income 46.3
high-income 37.5


Focusing on income rather than education doesn't change a thing: money moves them left. Contrary to expectations, poorer, less assimilated folks are not especially liberal. It's more accurate to say they lean Democrat. They become hardcore as they assimilate. Assimilation for immigrants leads them to become politically more and more like blacks.

Let's look at one more indicator that immigrant groups are moving to the social mainstream--job prestige:


Percent who voted for Bush in 2000

All immigrant groups
low-prestige 52.7
high-prestige 30.3

Mexicans
low-prestige 50.0
high-prestige 39.2

Same story. As immigrants move up, they move left and vote Democrat roughly 2 to 1. If conservatives want to survive as a viable political force, they must oppose immigration across the board.

So, what has all the pandering to immigrants gotten the Republican Party? A very clear message: go to hell.

And I'll say it again: neocons are either fools or liars, or both.

Sunday, January 13, 2008

Which immigrant groups become more conservative as they assimilate? The General Social Survey aksed 33,197 people living in America their ethnic group, their highest degree earned, and where they fall on the political spectrum. Answers on political views range from:

Extremely liberal=1
Liberal=2
Slightly liberal=3
Moderate=4
Slightly conservative=5
Conservative=6
Extremely conservative=7

I've listed below the mean scores:


Mean conservative score

Chinese
Less than high school 4.12
High school 4.02
Junior college 3.50
Bachelors 3.81
Graduate school 3.93

Mexican
Less than high school 4.03
High school 4.02
Junior college 4.08
Bachelors 3.89
Graduate school 3.57

Filipino
Less than high school 3.14
High school 4.21
Junior college 4.33
Bachelors 4.13
Graduate school 4.40

Puerto Rican
Less than high school 3.74
High school 3.97
Junior college 3.65
Bachelors 3.67
Graduate school 3.20

West Indian
Less than high school 4.31
High school 3.30
Junior college 3.00
Bachelors 4.11
Graduate school 3.67

Asian Indians
Less than high school 4.05
High school 3.73
Junior college 4.14
Bachelors 3.69
Graduate school 3.65

Neocons concede that most immigrants are liberal when they get off the boat, but their upward mobility and Old Country values gradually move them right. Well, looking at the numbers above--data that any yahoo can access--we see a grand total of one immigrant group following the path they predict: Filipinos. One outta six ain't bad, right? And our largest group--Mexicans--beats a path to the left as they become more educated. Neocons are either incompetent analysts, or they secretly want this country to move left, and are simply lying to us.

(I'm sure skeptics will say that I need to analyze income and voting behavior rather than education and orientation. I'll do that next).

Thursday, January 10, 2008


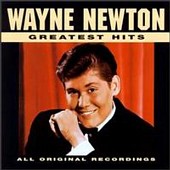
What percent of whites claim American Indian as their second race? You hear whites all the time taking pride in their having a American Indian (AI) great grandfather, or whatever. I just saw Wayne Newton on Larry King the other night bragging about how he is a descendant of Pocahontas. (His father was Irish-Powhatan and his mother German-Cherokee.)

The General Social Survey cannot tell us how many whites claim a distant ancestor, but it can tell us how common it is for a white person to see himself as also being AI. More than 8,700 whites were asked by the General Social Survey if they had a second race. Only 3 percent (2.98% to be exact) answered "American Indian." Now, how many AIs say their second race is white? It's 29.1%. But only 2.73%report that their second race is black.

How about blacks claiming to also be AI? Only 5.87%. And the percent of blacks claiming white as a second race? Even fewer: only 2.43%.

Wednesday, January 09, 2008

Living in America makes you fatter, and not in a good way: People who participated in the National Health Interview Survey were measured for weight and were also asked how many years they had lived in the United States. People gain weight as they age, so I calculated mean pounds for those between the ages of 31 and 35 (N=1,202), and this what I found:


Mean weight in pounds

Men
less than one year in U.S. 164.65
1 to less than 5 years 160.78
5 to less than 10 years 164.36
10 to less than 15 years 165.36
15 years or more 172.56

All American men ages 31-35 181.03

Women
less than one year in U.S. 132.71
1 to less than 5 years 131.99
5 to less than 10 years 133.67
10 to less than 15 years 137.93
15 years or more 139.68

All American women ages 31-35 143.82

It looks like people drop a little in the first few years, but after that they get fatter. But immigrants here even 15 years or more are still several pounds lighter than average. (If you're paying attention, you might be thinking that they remain lighter because they are shorter. I created a new variable by dividing weight by height. The mean score for all American men is 2.57, and 2.23 for women; for immigrants here 15 years or more, it's 2.51 for men and 2.19 for women, so you have a point).

There was a time when gaining a few pounds after reaching America's shores might have been a good thing, but I doubt it is now.

Monday, January 07, 2008

Race and science: The new Will Smith movie, I am Legend, is about a black scientist who is the last man alive after a worldwide epidemic wipes out all humans. It is up to him to discover a cure. This plot reminded me of the popular archetype of the black doctor/scientist. I'm thinking, for example, of Joe Morton who has played this type at least a half-dozen times (including the computer whiz in Terminator II) and of course Bill Cosby's Dr. Huckstable and Dr. Hibbert from the Simpsons. (List others if you'd like). I suppose I can understand pushing this archetype to send a message to young blacks that the absence of this kind of people in your own life does not mean you cannot be one, but it is a bit annoying. I find myself thinking, "Okay, a black scientist--helping the black kids, got it," when I should be getting lost in the story.

But my real interest here is to investigate the question of whether blacks are really interested in science, and if not, is it the Man's fault? Now white racists might be able to deny you good lab equipment at your local school, but they cannot dictate which TV shows you watch. The General Social Survey asked 1,468 Americans if they would hypothetically be interested in watching a TV program on the ozone. Here are the 8 ethnic groups with at least 50 respondents:


Percent who are likely or very likely to watch TV science program

Italian 70.4
Scottish 68.7
German 67.5
Irish 67.4
English/Welsh 67.2
Amerindian 66.2

USA 65.9

Mexican 62.3
Black 51.9

Blacks are at the bottom of the list. No one put them there. As a group, they are simply not as interested in science as other groups. Haven't you ever heard a black comedian making fun of how white people like to do weird things like study bugs? Little E.O. Wilson, spending all day hanging out with ants, must have been retarded or something, right?

People are different. So what. Get over it.

Saturday, January 05, 2008

Are Jews altruistic in a particularistic or universalistic way? I have heard both claims. The General Social Survey asked close to 2,700 Americans about their religious affiliation and a number of questions about giving help to strangers. Here are the percentages:


Percent who have done it at least once in the past year

Given directions to a stranger
Protestant 87.1
Catholic 88.3
Jewish 92.7
None 90.4

Offered a seat to a stranger
Protestant 43.9
Catholic 46.0
Jewish 59.5
None 50.4

Carried a stranger's belongings
Protestant 44.4
Catholic 49.2
Jewish 42.9
None 51.2

Allowed a stranger to go ahead in line
Protestant 88.7
Catholic 87.0
Jewish 87.8
None 87.3

Given money to a homeless person
Protestant 62.4
Catholic 65.4
Jewish 70.7
None 70.9

Donated blood
Protestant 15.6
Catholic 17.5
Jewish 11.9
None 16.5

There is no evidence that Jews are much different than anyone else. Where their numbers are a little higher, they probably have the advantage of more opportunities to help because of living in urban areas in high numbers. For an altruistic behavior that requires more effort and is less opportunistic, like giving blood, Jews fall behind a bit.

And notice how people with no religion are just as altruistic as those claiming one--maybe more so.

Monday, December 31, 2007

God versus Darwin: What is the best predictor of belief in evolution? I guessed education, but I was wrong. The General Social Survey asked a representative sample of Americans in 2006 whether the idea that humans evolved from earlier animals is true or false. Only 49.6% said true. Here is the list of predictors I included in a multivariate model, and the standardized OLS coefficients. (I know, I know--my dependent variable should be normally distributed when estimating OLS coefficients, but the technique is robust enough to handle a dichotomous variable that is evenly distributed between the two categories).


Belief in evolution (standardized OLS regression coefficients)

Age -.07
Sex -.08
Race -.01*
Years of education .17
IQ .14
Informed about sci/tech .07
Liberal politics .14
Church attendance -.34

R-squared .29
Number of valid cases 737

* not significant at .05 level, two-tailed test


Except for race (black v. white) all the effects are statistically significant. Men and younger people are more likely to accept evolution, but the tendency is slight. Being more educated, smarter, or saying that you are informed about science and technology is not particularly predictive--at least not more than being liberal.

It turns out that the bigger winner is religiosity--as church attendance increases, so does skepticism about evolution. Seventy-two percent of people who never go to church believe we evolved from earlier animals: the number for those who attend more than weekly is only 13%! God and Darwin may not necessarily be logically incompatible, but there is a clear sociological divide.

Friday, December 21, 2007

Sixteen percent of female veterans are lesbian: Folks with their eyes open can see that gay men are more feminine than straight guys, while lesbians are more masculine than hetero women. Don't believe me? Well, let's test the hypothesis with the military. I bet that the percentage of female veterans who are lesbian is higher than the share of male veterans who are gay. The General Social Survey asked 3,644 Americans about the gender of their sex partners, and if they have served in the military. Here are the percentages who are gay and straight (warning: samples sizes are low for homosexual men and lesbians):


Percent who are homosexual

Male veterans 1.5
Male non-veterans 3.2
Female veterans 15.6
Female non-veterans 0.9

See? I told you so.

Tuesday, December 18, 2007

Religion appeals to the smart, but not the really smart: It's my impression that the smarter the person, the less religious they tend to be. I figure that smart people read a lot, and as one digs deeper into any religion, it is unlikely to bear careful scrutiny. On the other hand, there are many intelligent people who are very involved in a particular faith, so let's have the data decide. The General Social Survey asked 22,845 people how often they attend church, as well as administering to them a ten word vocabulary test. I calculated mean attendance at each level of questions answered correctly:


Mean church attendance

0: 4.08
1: 3.91
2: 3.90
3: 3.80
4: 3.79
5: 3.84
6: 3.92
7: 3.97
8: 4.01
9: 3.70
10: 3.70
Total: 3.87

A "4" means the respondent attends monthly, "3" is a few times a year, and "5" is 2 or 3 times a month. The two smartest categories go to church the least: even less frequently than the low-IQ folks who would be expected to show less middle-class conformity. I'm not surprised that peak attendance is seen among smart, but not really smart people. (The modal category for vocab is 6 out of 10 correct). Highly intelligent people can be religious, but evidently it is an uphill battle.

Saturday, December 15, 2007

India: A survey-based profile

In previous posts, I've drawn characterizations of a number of large countries (United States, China, and Mexico) based on World Values Surveys. Now, I would like to report what I found for India. In 1990, 2,500 Indians were sampled and asked more than 200 questions about their values and beliefs over a broad range of areas: work, family, religion, government, and nation. I list below those questions where Indian responses were in the top three or bottom three among all the countries surveyed (Ten to 50 countries were surveyed, depending on the question. Keep in mind that the sample was tilted toward more-developed countries). This strategy allows us to see in which ways a country is distinctive. There are many questions where Indians were in the middle, which indicates that the country is not much different than a typical country in the sample on many issues:


Top 3
work is very important in my life
I enjoy my work: it is the most important thing in my life
most important aspect of a job is the chance of promotion
there are people in the country who are poor because they are lazy


no previous marriages
spouse has same attitudes toward religion; social attitudes
faithfulness is very important for a successful marriage
same background is very important for a successful marriage
sharing household responsibities is very important for a successful marriage
a preschool child will suffer if mom works
children should be encourage to learn good manners; obedience
approves of abortion if mom is single
approves of women's movement


belongs to a religious denomination
brought up religiously at home
believes in reincarnation

has a lot of confidence in church; armed forces; civil service; political system
proud of country's scientific achievements
proud to be Indian

does not want criminals for neighbors
does not want left-wingers for neighbors
does not want drinkers for neighbors
does not want unstable people for neighbors
does not want foreigners for neighbors
does not want people with AIDS for neighbors
does not want drug addicts for neighbors
does not want homosexuals for neighbors
does not want Jews for neighbors

trust my family
trust my nationality
trust my ethnic group


cheating on taxes; married people cheating; homosexuality; prostitution; divorce; suicide are never justified

we have to accept environmental problems to combat unemployment


Bottom 3

during the past few weeks, I felt pleased about something I accomplished
success is due to luck and connections, not hard work
work should become less important in our lives
self-development should become more important

parents talked about sex
agrees with the idea of sexually freedom
marriage is outdated
approves of single motherhood
being a housewife is just as fulfilling as a paid job
there should be more emphasis on family life

it is proper for churches to speak out on abortion; disarmament; Third World problems; extramarital affairs; unemployment; racial discrimination; euthanasia; and ecology

believes in resurrection

if an unjust law were passed, I could do nothing about it


Summary: Based on the list, India can be characterized as: work-oriented; socially conservative but in favor of reforms for women; moralistic; religious; against politically active religion; not tolerant; trusting of those in power and other Indians; ethnically and nationally proud; and politically self-efficacious.

Friday, December 14, 2007

Censorship at freedom-loving Chronicles

My comment was just deleted from this thread at Chronicles. I was debating Mr. Fleming about Mormonism. In a nutshell, he wrote a series of posts about how dreadful that religion is, and I defended it. He seems to like writing all sorts of nasty things about people and groups, but when I responded in kind, he showed his little-girl sensitivity and deleted my last post. So, in case any of the readers of that thread wander over to this blog, here is my (paraphrased) censored post:

1. Fleming claims I am a liar: I say I'm one faith, when really I'm secretly Mormon. I told him to give me an e-mail address, and I'll have my priest vouch for me. [This outrageous offer really deserves censorship, no?] I then told him his baseless maligning of me and a perfectly respectable religion (Mormonism) reveals a shriveled soul. (Fleming is free to come here and call me anything, and it will, of course, not be deleted).

2. Fleming droned about how prohibiting Catholic and Orthodox members from associating with members of another faith is not superstitious, and proceeded to give me the endless history--what a windy prof--explaining that prohibition. I then responded that, by his way of arguing, only the policies of our faiths can be given historical explanations to show they are understandable and reasonable. Every Mormon practice, however, is wacko, sinister, or stupid.

3. Fleming admitted that he is not a good enough person to pray for people like Mormons to become Christians. I responded, exactly, the truth emerges. I told him that my wife read his comments and suggests that he go to confession.

UPDATE: It now looks like I have been banned from posting at Chronicles--I attempted unsuccesfully to post that my previous comments had been deleted, and could be found here at my blog. The enemies of the Old Right may have a point about there being fascists (and bigots) in our ranks.

My Chronicles link will remain, however, because I don't censor.

UPDATE II: I see that Fleming has also banned the Mormon commentator on this thread. So he can trash them, but then does not allow a response. He's too thick to realize that this approach just convinces Mormons that everyone is out to get them and therefore is proof of the truth of their faith.

Tuesday, December 11, 2007

Getting a break on a traffic ticket is degrading


As a follow-up to the last post, I looked at the 10,792 men and women who were asked if they ever received a ticket for a traffic violation. Exactly 65.5% of men did, but only 30.0% of women have been ticketed. Now, the God of Equality has written on tablets that men and women are interchangeable, so these numbers do not reflect differences in driving. So law enforcement must be targeting men, but no... wait... the God of the Underdog has written on other tablets that the powerful exploit the powerless, so the cops must somehow be going after women.... I give up--I guess the Gods' ways are mysterious, and we must walk by faith.


Aha! I knew the Gods would show me the way. Men objectify women, and since they see them as sex objects and not human beings, they think giving a woman a break might lead to sex, and so they deny her the dignity of receiving a ticket like any fully human person would get. Yes!

Saturday, December 08, 2007

Mex-Ams are the worst drivers: A large sample of Americans (8,517) was asked by the General Social Survey if they had ever been given a traffic ticket. I calculated the percent who answered "yes" for every ethnic group with at least 100 respondents:


Percent who ever received a traffic ticket

Mexican 54.8
English/Welsh 51.3
Scottish 50.9
Norwegian 50.0
Amerindian 49.4
German 49.2
Czech 47.9
Irish 47.0
Italian 46.6

USA 46.3

French 45.5
Jewish 44.9
Russian 43.7
Polish 42.9
Swedish 42.8
Black 38.5
Dutch 37.7

Some of the pattern might be explained by where you live: people of English, German, Scottish, Norwegian, or Amerindian ancestry are disproportionately rural/small town/suburban--areas where people drive a lot. But this does not get Mex-Ams off the hook. They tend to be urban: Seventy-two percent live in more populated areas, compared to 62% of Americans.

And take notice of all those African Americans who are being ticketed for "driving while Black."

Thursday, December 06, 2007

Married women who are very liberal are most likely to cheat or be in an open relationship: The General Social Survey asks participants their marital status and the number of sexual partners one has had in the past year (N=3,330). Here are the numbers for women:


Percent of married women who had more than one sex partner in the past year

Extremely liberal 9.6
Liberal 3.7
Slightly liberal 2.9
Moderate 1.7
Slightly conservative 1.7
Conservative 1.5
Extremely conservative 4.2

One out of ten extremely liberal married women had sex with someone other than their husband. So all you guys out their who like to sleep with married women, you now know where to focus your search. (If your town is short on radicals, the extreme Right seems to be the next best choice.)

Saturday, December 01, 2007

More Mexican Americans use drugs than any other group: General Social Survey respondents (N=1839) were asked if they had used illegal drugs in the past year. Here are the percentages who answered yes by their ethnic background:


Percent who used illegal drugs in the past year:

Mexican 9.0
Amerindian 6.7
Scottish 6.6
English/Welsh 6.6
German 6.6

USA 4.8

Irish 3.3
Italian 2.8
Black 1.8

This accords with other survey data which indicate illicit drug use is high for Native Americans and Mex-Ams, moderate for whites, and low for blacks. Something new is that use is lower for whites from Catholic countries.
Question: Can the Holy Trinity legally drive in the carpool lane?

Tuesday, November 27, 2007

Religion, immigration, and abortion: With 2006 General Social Survey data now being available to the public, we've now got enough cases (when added to earlier years) to analyze small religious groups. Listed below are the percent who think a woman whould have the right to have an abortion for any reason:


Percent in favor of right to an abortion for any reason


Jewish 77.8
Buddhists 71.1
None 66.3
Eastern Orthodox 56.2
Hindus 50.0
Inter-denominational 48.9
Muslims 44.4

USA 40.1

Christian 39.2
Catholic 35.4
Protestant 36.0

These numbers explode the myth that immigrants make the country more socially conservative. Buddhists, Hindus, Orthodox Christians, and even Muslims have above-average percentages. The table looks like various immigrants with Jews and the non-religious all lined up against native-born Christians. But of course, that's not right since Mexicans and Filipinos are large immigrant groups and are heavily Catholic (Mexicans 73.2%, Filipinos 77.1%). Let's look at the views toward abortion for immigrant groups:


Percent in favor of the right to abortion for any reason

Russians 77.4
English/Welsh 64.3
German 50.8
India 49.2
Polish 47.9
China 47.8
Irish 46.3
Scottish 44.1
Arab 41.7
Africa 37.1
Filipinos 35.0
Spanish 30.9
Italian 29.3
Puerto Ricans 23.5
Mexico 20.6

Those from Catholic countries have below-average numbers, except for Ireland and Poland, which like the rest of Europe (except for Spain and Italy) suck. Let me add that Asian Indians suck and Chinese immigrants suck too. Put Arabs on the suck list, but Africans are okay.

The problem with Mexicans is that, compared to immigrants, those born here move to the left: thirty four percent favor abortion on demand.

Saturday, November 24, 2007

Ethnic loyality among Jews: A theme I often run across on the blogosphere is the extent to which Jews think about collective Jewish interests when forming political views. People often confuse four different entities: 1) a relatively small number of famous elites; 2) Jewish elites in general; 3) major Jewish organizations; and 4) Jews as a group. This website is devoted to data, especially survey data, and such an approach lends itself to assessing question #4. In past posts, data have indicated that only a minority of American Jews are what could be termed ethnocentric. The only measures I have seen which demonstrate consensus or something approaching consensus have been Jews' belief in immigration and preference for Democratic political candidates.

One measure of ethnic loyalty available from the General Social Survey is whether or not you think of yourself as mainly an American when considering social and political issues, or as a member of an ethnic group. Almost 1,200 people were asked this. Here are the percentages who answered "mainly just as an American":


Percent who think of themselves as just an American

German 99.2
English/Welsh 97.5
Protestant Irish 97.1
Scottish 95.2
Catholic Irish 94.7
Amerindian 92.2

USA 88.8

Italian 88.2
Jewish 84.1
Mexicans (born in U.S) 83.3
Black 56.5

A commentor at Sailer's blog claimed that American Jews are like Irish Americans, but the data tell us that they are more like Mexicans: most don't form opinions qua minorities, but some do.

Thursday, November 22, 2007

Which ethnic group has the classiest tastes? There are all kinds of good music, but you must admit that there are only three kinds that we would call really classy: classical, opera, and jazz. So who likes these types of music the most? The General Social Survey asked almost 1,200 Americans about their musical preferences. Answers ranged from "like it very much" (1) to "dislike it very much" (5). I calculated the means for ethnic groups with at least 30 respondents, and subtracted them from 5 so that higher scores indicate more preference for the music:


Mean classical music score

Scottish 2.77
Jewish 2.65
Polish 2.53
English/Welsh 2.52

USA 2.43

Italian 2.41
Irish 2.32
Dutch 2.39
German 2.32
Black 2.12
Amerindian 1.87


Mean opera score

Polish 1.86
Scots 1.83
Italian 1.74
English/Welsh 1.61
Dutch 1.58
Jewish 1.58

USA 1.57

Black 1.55
German 1.46
Irish 1.41
Amerindian 1.31


Mean jazz score

Black 3.05
Jewish 3.00
Polish 2.63

USA 2.44

English/Welsh 2.41
Irish 2.40
Italian 2.38
German 2.29
Scots 2.24
Amerindian 2.19
Dutch 2.00


Not surprisingly, Blacks like climb to the top of the list for jazz, and Italian Americans move up for opera. But overall, Polish Americans are at the top. Jews aren't too crazy about opera, and people of Scottish descent like classical and opera but not jazz. Amerindians don't dig any of it.

Tuesday, November 20, 2007

Is it just an unfair stereotype that women have more emotional difficulties than men? The General Social Survey asked 1,410 Americans if, in the past 4 weeks, emotional problems had prevented them from accomplishing as much as they would like. Here are the percentages who said yes:


Percent reporting emotional difficulties

Women 21.8
Men 14.8

That's about 50% more women than men. Skeptics will claim that women are only more likely to report emotional difficulties, but the question is quite specific: it is asking for the type of emotional difficulty that undermines productivity.

I can't speak for all couples, but in my marriage my wife is usually more (negatively) emotional, and I'm the reassuring one.

Friday, November 16, 2007

Having a gun stuck in you face is a common experience

The General Social Survey asked 6,599 men if they had ever been threatened with a gun or shot at. Here are the percentages by ethnic group:


Percent ever threatened with a gun or shot at

American Indian 44.9
Mexican 42.3
Blacks 42.1
French 35.9
Protestant Irish 34.8
Czech 33.3
Russian 32.4
German 32.0
Jewish 31.7

USA 31.5

Catholic Irish 31.4
Scottish 30.0
English/Welsh 29.2
Austrian 27.5
Danish 26.9
Swedish 26.3
Polish 26.0
Italian 24.3
French Canadian 22.7
Dutch 15.5
Asian 12.5

My first reaction is the frequency of this type of victimization: almost 1/3 of all males. I must hang out with the right kind of people because this has never happened to me or anyone I know. (The numbers might be inflated a bit by reports of military experiences). Seconds, NAMs (non-Asian Minorities) inhabit the most violent worlds. Amerindians face a higher risk of victimization than either blacks or Mex-Ams. Whites are in the middle, and Asians (Chinese, Japanese, and Filipino) are not surpisingly at the bottom. These numbers suggest that being a victim is corrrelated with being a perpetrator: assaulted one day, assaulting the next. Even though Asians tend to be urban, they have very low rates of victimization. Why? Well, they don't provoke others, and much of the time they are moving among other Asians--a group whose members rarely point guns at people.

Thursday, November 15, 2007

Compared to 1990, twice as many favor marijuana legalization


Since 1973, General Social Survey respondents have been asked if marijuana use should legalized. Looking at the graph, we can see that support has been on the increase since the early 90s. In a graph not shown, about 50 percent of young people (ages 18-30) now favor legalization. The feeling that people should be able to do whatever they want as long as nobody gets hurts has evidently been growing incrementally over the past 2 decades (with a plateauing in recent years).

Monday, November 12, 2007

My faith in the people's wisdom is restored: GSS respondents were asked how scientific is the discipline of sociology. I display the answers below, along with attitudes toward biology for the sake of comparison.


Percent saying sociology is scientific

Very scientific 8.6
Pretty scientific 43.8
Not too scientific 30.3
Not scientific 9.1
Haven't heard of it 8.2


Percent saying biology is scientific

Very scientific 71.7
Pretty scientific 24.6
Not too scientific 2.1
Not scientific 0.8
Haven't heard of it 0.8

I am so pleased to learn that only 9% of people think a discipline that believes that behavior is 100% environmentally produced is "very scientific." Yes, you might find an odd sociologist who accepts that genes and biology matter, but sociology did not convince of him of that.

And I am also tickled to learn that 8 percent of people haven't even heard of sociology! Were it 80%!
Is there a declining interest in science? Over at Steve Sailer's blog, there was a recent discussion about a loss of interest in science. I wondered if it were true of the population in general and mined some data from the 2006 science module of the General Social Survey. Respondents were asked if they would be interested in a TV program on the polar regions. I calculated the percentages who said they would be "very likely" to watch the show by age range:


Percent who are very likely to watch a TV science program

18-30 25.1
31-45 30.7
46-60 41.8
61+ 40.1

Now, I can't tell if these differences show a dropping in interest in science, an age effect (a tendency to like science more as one ages) or a cohort effect (something--like landing on the moon--impacted specific age cohorts). It's not due to more TV watching in general on the part of older people: only seniors watch (slightly) more TV than 18-30s.

If younger people are turning away from science, it's not for lack of studying it in school. Respondents were also asked if they took a physics class in high school:


Percent who took physics in high school

18-30 41.0
31-45 34.0
46-60 24.4
61+ 26.7

Science is difficult, technical, and dry. Traditionally a nerdy white guy thing, most of those types I see on campus now don't have the discipline for it.

Monday, November 05, 2007

Lazy Americans? The open borders crowd gleefully tell us how much immigrants inject energy into an otherwise lazy America. Well, I looked at data from the California Workforce Survey to see who does the most overtime. Respondents (N=868) were asked how often they worked more than 40 hours a week. Here are the percentages who said "usually" by racial/ethnic group:


Percent who usually work overtime

White 31.2
Black 22.4
American-born Hispanic 24.2
Immigrant Hispanic 26.2

Those fat, lazy white people might be fat, but they ain't lazy.

Saturday, November 03, 2007

Long gun ownership on the decline


As a follow-up on the post about the decline of hunting, I generated these stacked bar charts showing trends in the household ownership of rifles, shotguns, and pistols. You can see that fewer people own either type of long gun which matches the dropping interest in hunting. The rate of handgun ownership, by contrast, seemed to grow very slightly until about a decade ago, probably in response to fear of crime, and may be slipping a bit more recently as crime rates have fallen. The NRA and all lovers of self-reliance must not be too happy about these trends.
One-third of very old blacks thinks the IQ race gap is genetic: As a follow-up to the last post, I wanted to look further into this very odd phenomenon of blacks who believe that their group does not learn as well because of inborn differences. I discovered that many elderly blacks (ages 70-90) believe this, especially if they were asked this question in the 1980s and were, therefore, born in the early part of the 20th century. The number for this group is 33 percent. Is the high number the result of experience and freedom from modern-day indoctrination, or were they indeed indoctrinated, only by the segregationist culture of their youth? I report, you decide.

Tuesday, October 30, 2007

Fewer Americans believe genes explain the race IQ gap

Whites


Blacks


Other races


I haven't taught for 30 years, but combining my time as student and teacher, it has been my impression in the classroom that people have grown less inclined to turn to genes as an explanation for behavior. This has seemed odd to me since scholarship has turned increasingly in that direction over the same period. The best scientists have been telling us one thing, while the classroom instructors, the media, and the public have been telling us something very different.

But this has all been my sense of the situation, so let's see what the data say. The General Social Survey has asked since 1977 if respondents agree that blacks are poorer and have worse jobs and housing because of an innate inability to learn. Over that time more than 20,000 Americans have answered that question, and the results for whites, blacks, and "others" are displayed above. The first year is 1977 and the last is 2006.

My hunch was correct. For whites, those agreeing dropped steadily from 27% in 1977 to 8% in 2006. Blacks have been asked this question only from 1985 on, and those agreeing fell from 18 to 12% over the period. Notice, how more blacks than whites look to genes now. The sample sizes are small for "others" but their numbers have fallen as well.

This suggests that public opinion does not follow science, at least in the short run. It follows instead the cultural and political trends of the time. There is something like a 50 year lag, and we've been under the dominance of the extreme environmental determinists for a long time now. Maybe before I'm dead the race realists will lead the culture, but I ain't putting any money on it.

Sunday, October 28, 2007

Growing prissiness among American men? I looked at the General Social Survey to see if hunting is on the decline and if males hunters differ from other guys in IQ. Here are the numbers (total sample=11,659):


Percent of men who hunt
1977 34.1
1987 25.1
1996 27.8
2006 18.9


It sure is in decline. Is this a sign of a increasing prissiness among American men? Perhaps the couch is more comfortable and the Xbox safer and less work?


Mean IQ

Whites
Hunters 95.4
Non-hunters 100.8

Blacks
Hunters 86.6
Non-hunters 90.9

For both races, hunters are 4 or 5 points less intelligent. I don't imagine this was always the case: who hunted more than aristocrats? Is it a growing refinement of the right half of the bell curve? Once again, who was more refined than aristocrats? The American Male has morphed from Jim Bowie into David Bowie. (The singer got his name from the Alamo hero, by the way).

Thursday, October 25, 2007

Approval for spanking is on the decline: Since 1986, the GSS has asked Americans if they feel that spanking is sometimes necessary. I looked the percent who said no:


Percent thinking that spanking is not necessary

1986 16.5
1996 27.1
2006 27.7

There was a jump in the late 80s, but it has leveled off in the past decade. This matches the trend I have witnessed in the classroom: more people seem to be uncomfortable with not only spanking, but also punishment in general. I could count on one hand the number of times I have spanked my kids, but no punishment? You gotta be crazy. No wonder we have so many poorly behaved kids.
Dumb people watch a lot of TV: I was pretty sure that brainiacs don't watch much TV, but it is blog policy to verify with hard data. The General Social Survey asked 14,233 Americans how many hours per day do they watch television. I calculated means for three levels of IQ by race:


Mean hours of TV per day by IQ

Whites
High IQ (126) 2.08
Medium IQ (98) 2.87
Low IQ (77) 3.24

Blacks
High IQ (126) 2.89
Medium IQ (98) 3.77
Low IQ (77) 4.06


It is true that IQ varies inversely with watching TV for both blacks and whites, but it interesting that blacks watch roughly an hour more than whites at the same IQ level. TV is a low-energy way to pass one's free time; whites might prefer more active pursuits. There aren't enough Mexican Americans to do the same analysis, but their overall mean is high at 3.48 hours per day.

Friday, October 19, 2007

Is IQ correlated with skin tone among blacks? The General Social Survey gave 437 blacks an IQ test (10 vocabulary words) and interviewers also recorded how dark their skin was from "very dark brown" to "very light brown." Here are the means:


Mean IQ by darkness of skin

Very dark brown 86.99
Dark brown 84.05
Medium brown 90.38
Light brown 92.77
Very light brown 90.99
All blacks 88.91

You might wonder why the mean is not 85 for all blacks--the black-white gap is not as large for verbal ability. Also--due to small samples, the only significant differences at the 95% level are medium and light over dark.

Dark and light browns are almost 9 points apart, a gap more than large enough to produce classes among blacks based on skin color. (Or the color-based classes produced the IQ gap?)
More than 1/3 of libs approve of sex among 14 year olds: The General Social Survey asked 16, 973 Americans about their political orientation and how they felt about 14-16 year olds having sex. Below you'll see the percentage who said it's not wrong or only sometimes wrong:


Percent who think sex among 14-16 year olds is not wrong

Extremely liberal 34.9
Liberal 22.4
Slightly liberal 15.6
Moderate 12.2
Slightly conservative 11.0
Conservative 6.5
Extremely conservative 7.7

What is wrong with you libs? Either you're total relativists--"bestiality isn't wrong if no one gets hurt"--or you make yourselves stupid by dropping all context: "well, nature has made these two 14 year olds capable of sex, and they do it in Timbuktu, so who are you to deny them their human rights?" The belief that every consensual act done by anyone at any time is peachy is dogmatic and is short on common sense.

Tuesday, October 16, 2007

American Indians are the most anti-immigrant (that's the Indians with the feathers, by the way): Using General Social Survey data, I calculated a mean score for each ethnic group in America on a question if one agrees that immigrants' ideas and culture improve American society. Answers ranged from "strongly agree" (1) to "strongly disagree" (5) so a high mean indicates that the group is least likely to think that immigrants make things better.


Mean anti-immigration score

American Indian 2.76
German 2.65
Irish 2.63
Italian 2.62
Blacks 2.53

USA 2.50

English/Welsh 2.42
Mexican 2.23

The focus on immigration these days is from Mexico, so it is no surprise the poor minority groups see little benefit from having tens of thousands of low-skill immigrants come to the U.S. each year to compete with them for jobs. Black liberalism offsets this a bit; American Indians are not as liberal. White ethnics seem less likely to buy the hype as well. Ethnic solidarity seems to trump job competition for Mexican Americans.

Saturday, October 13, 2007

Young people increasingly against abortion


The question of the values of young people interest me since they indicate the direction in which the country is moving. The General Social Survey has been asking Americans about their attitudes toward abortion since 1972. I generated these graphs to show the trends in views of women ages 18 to 30 (yearly samples range from 110 to 250). Men of the same age group show similar trends, but the the pattern is a bit stronger for females. What we see is a basically flat trend (if you smooth out the wrinkles) until the mid-90s. At this point, feeling that abortion should be permitted begins to drop. This pattern holds for all the reasons given for an abortion.
So why are young people shifting toward more conservative values on abortion? Are they reacting to the excesses of their parents? We see a big drop circa 2000--are some young folks rejecting Clintonian sleeziness? Are evangelicals making inroads among this demographic?
Paleos dread Giuliani in the White House because endless war means more dead soldiers. Compared to hundreds of thousands of embryos and fetuses killed in cold blood every year, a few thousand guys who volunteered to die for honor and glory is small potatoes. Insider Republicans have already pissed little people like me off over issues of the war and immigration. Abortion is a vote determinant for quite a few voters (my mom doesn't give a damn about anything else), and people like me and an increasing number of young people are going to stay home or find another party if candidates like Giuliani are foisted on us.
Jews and cheating the government: My wife reminded me that in an analysis I did some time ago on ethnic differences in attitudes toward cheating on taxes, Jews were the worst, but that I didn't include them in the last post on lying to get benefits. So I calculated the estimate for the 49 Jews in the GSS sample, and zero percent said that it is not wrong to do that. Perhaps the differing results can be attributed to taxes being of particular concern to this wealthy group, while obtaining government benefits is more relevant to poor people.

Friday, October 12, 2007

Attitudes toward cheating the government: Americans (2,032 of them) were asked by the General Social Survey if it is wrong to give the government false information in order to get benefits. I calculated the percent who said it is not wrong by ethnic group:

Blacks 16.2
Puerto Rican 13.7
Mexican 11.7
Polish 11.3
American Indian 6.1
Italian 6.0
German 5.6

USA 5.6

Irish 4.1
French 1.9
English/Welsh 1.7
Scottish 0.0

Americans of Western European descent are the most honest, while poor minorities (except for Amerindians) and Eastern Europeans are least honest.

And by now you must think I'm harping on this point, but as our largest immigrant group--Mexicans--continues to pour into the country, the number of people trying to cheat the system will increase.

Thursday, October 11, 2007

The most amazing thing I have heard in some time: Today, the Dean--a man who has spent much of his career trying to fill the school's faculty vacancies with women and minorities--in a room of six women, two Hispanics, one black, and one white man, said that only a sick racist would believe that white men are the group most discriminated against. (He was referring to comments in class by students that we faculty need to put a stop to.)

Tuesday, October 09, 2007

Does getting arrested help or hurt your chances of getting laid? Is it really true that that girls are attracted to bad boys? The General Social Survey asked 168 men ages 18 to 30 if they were arrested in the past year, and they were also asked how many sex partners they had during the same time period. Here are the mean number of partners:


Mean number of sexual partners in the past year

Arrestees 3.04
Non-arrestees 1.67

No competition. The brutes flout the law and deflower the girls, and evidently the girls like it.

Sunday, October 07, 2007

Stuck-up street people: An amusing thing happened to me today, and I wouldn't mention it except that something very similar happened just a fews days before.

Roughly 90% of the panhandlers that hit me up for money are black in a town that's maybe 15% African American. The rest are white--I cannot recall a Hispanic ever asking me for money. And we are not talking a small sample size. In many parts of town, I cannot get out of my car to fill up the tank without someone delivering some lame story why they need my loose change. And I usually give them the coins in my pocket just so they will just leave me alone.

The other day, a very experienced bum approached me, saying something incoherent about needing change to cash a check for $20 (I thought, "Huh? Are you serious with that?"). I reached in to draw out my normally abundant load of change, and discovered that I had one dime. I told him all I had was the ten cents, and handed it to him. Then the amusing part happened: he totally snubs me! He gave me a haughty look, turned away coldly, and made me feel like a dirty beggar!

Then, today, someone sent a girl over to me with a story about them needing gas money to make it home. So I reach in and hand her about 75 cents, and this 12 year old hustler gets a sour look on her face and marches away irritated--and forget about her saying thanks.

I'm thinking about starting a march where I hold up a poster that reads: "To all you panhandlers: I am a Man!"

Thursday, October 04, 2007

Does Hispanic immigration help Republicans in unexpected ways? Republican "strategists" tell us that immigration from Latino countries is good since these people, under all their liberal voting, are natural conservatives who embrace hard work and family values. People like me who actually consult the data know better, but what about the idea that a greater Hispanic presence drives whites to the right?

California is a great place to test this hypothesis since the Latino population is high but varied. I examined data from the 2000-2001 California Workforce Survey, where white residents were asked their party affiliation as well as the percentage of their community that is Hispanic. The sample size was 211, so I split the group roughly by forming one group of those who said that the Latino presence was somewhere between 1 and 3 out of 10; the other group was 4 to 10 out of 10. In the low-Hispanic group, 21% of whites said they were Republicans; for the high-Hispanic group, the number was 30%. Not a huge difference, but noteworthy.

It is also surprising, given that wealthy people can most easily select themselves out of high-Hispanic (poor) areas, and since wealthy people are more likely to vote Republican, this should decrease the Republican presence in Hispanic communities.

I would not be surprised at all to see whites grow increasingly race conscious and turning to the Republicans to deliver pro-white policies, as the country diversifies. The recent defeat of immigration amnesty is probably a sign of this.

Wednesday, October 03, 2007

Fear-mongering feminists


Readers have expressed skepticism that feminists are pushing the idea that marriage is dangerous for women because of the high risk of wife battery. Here's a little visual evidence I found on the Internet.

Monday, October 01, 2007

Mexican-Americans are least likely to read newspapers: If people are going to be good citizens, they need to be well-informed, and reading the daily newspaper is a big help. So which ethnic groups read the paper the most? The General Social Survey asked 24,672 Americans how often do they read the paper, with answers ranging from never (5) to daily (1). I calculated the means for each ethnic groups with at least 100 respondents (unless noted), then I subtracted the estimate from 5 so that the highest numbers reflect the most frequent reading:


Mean newspaper reading score

Poles 3.40
Lithuanians 3.38 (78)
Austrians 3.36
Russians 3.35
Danes 3.35
English/Welsh 3.23
Japanese 3.21
French Canadians 3.2o
Scots 3.17
Finns 3.16
Yugoslavs 3.16
Norwegians 3.16
Czechs 3.19
Swiss 3.18
Swedes 3.11
Dutch 3.11
Germans 3.11
Irish 3.10
Italians 3.10

USA 3.03

Hungarians 3.01
Chinese 3.00
West Indians 2.98
French 2.97
Greeks 2.97
Arabs 2.95 (N=41)
Blacks 2.83
Spain 2.83
Portuguese 2.81 (N=68)
Asian Indians 2.76
American Indians 2.63
Puerto Ricans 2.59
Mexicans 2.41

Eastern and Northern Europeans read the most, while Southern Europeans, Arabs, Asian Indians (I'm surprised) and poor minorities read the least. And like with so many of my lists, Mexicans fall to the very bottom. But hey, white racism cripples their motivation, and who can afford 50 cents these days? (By the way, did the rapper 50 Cent get his name from his love of newspapers?)

Saturday, September 29, 2007

Do blacks drink less than other groups? Surveys usually indicate the whites and Hispanics drink more than blacks. This is sometimes used to argue that blacks also engage in less problem drinking. (A black student once berated me for suggesting that blacks are less likely than whites to be arrested for DUIs because they drive less: she said any idiot knows that blacks drink less). The General Social Survey can shed some light on this question. Respondents were asked what was the maximum number of drinks they had in one day over the past year. Here are the percentages at different levels (Caution: the sample size is only 41 for blacks and 36 for Hispanics):


Maximum drinks in one day in the past year--percent in each category

Hispanics
Doesn't drink 8.3
1-4 drinks 58.4
5 or more 33.3

Blacks
Doesn't drink 31.7
1-4 drinks 46.3
5 or more 22.0

Whites
Doesn't drink 18.0
1-4 drinks 65.4
5 or more 16.6

These data help clarify the issue: blacks are more likely to be teatotallers and heavy drinkers, with fewer who are moderate.

And the Inductivist does it again: while answering a question about another topic, he runs across numbers that make Hispanics look bad. Of the three groups, they have the most heavy drinkers and the fewest abstainers.

Wednesday, September 26, 2007

Self-righteous libs are the ones with underperforming hearts: Readers expressed interest about altruism by ethnic group and political views, so here are the percentages who donated blood in the past year:


Percent who gave blood in the past year

Vote in 2000
Bush 20.3
Gore 14.5

Ethnic group
Dutch 23.3
Norwegian 22.1
Mexican 21.0
Irish 19.4
English/Welsh 19.3
Scots 18.3
Italian 17.6

USA 17.5

German 17.0
American Indian 14.7
Puerto Ricans 13.3
Black 12.9
Swedish 12.1
Jewish 11.9
French 10.9
Poles 9.6

Let me begin with the less interesting first: Americans of northwestern European descent appear to be the most altruistic (with Swedes as an exception--the blood alcohol content is too high for donation, perhaps?). Since I am always running into data that make Mex-Ams look bad, they should get their props here. And blacks are low, as a reader suggested.

Now for the fun part: conservatives can't possibly donate a lot of blood because you have to have a heart to have blood, right? WRONG: those self-righteous libs are actually the ones with underperforming hearts.
Religion and donating blood: Some readers evidently didn't like my analysis on religion and soft-heartedness. In their view, the measure I used is problematic, and behavior, not self-characterization, is the important question. Well, the Inductivist is here to please, so I have calculated the percent who have donated blood in the past year at least once by religion (I limited analyses to religions with at least 30 survey respondents):


Percent who donated blood in the past year

Christian 19.7
Catholic 17.5
None 16.2
Protestant 15.6
Inter-denominational 12.9
Jewish 11.9

These numbers do not support the view that religion generates altruistic behavior since those without a religion are ranked third in a field of six. Again, I am surprised that Jews are at the bottom.

Of course, it's conventional wisdom in sociology (if it can be said to possess any wisdom) that affiliation is not particularly potent--it's commitment to a religion that matters. So does blood donation vary by attendance?


Percent who donated blood in the past year by frequency of church attendance

More than weekly 19.7
Weekly 19.0
Nearly every week 17.4
Two or three times/month 19.8
Once a month 20.1
Several times a year 16.7
Once a year 14.4
Less than once a year 15.9
Never 11.1

Those who attend, whatever the frequency, are not that far apart, but the irreligious are noticeably stingier with their blood.

Wednesday, September 19, 2007

The social skills of brainiacs: Intelligent people are thought to be socially inept, and while I would agree that the brainiest are rarely the social butterflies at a party, the General Social Survey supports the idea that individuals with high IQs are social in the sense that they discuss things with a broader network of people. Participants in the survey were asked how many different people do they regularly discuss important matters with. Here is the average by IQ:


Mean number of people with whom you discuss important matters by IQ

High IQ (126) 3.17
Medium (98) 2.33
Low (70) 1.68

Dumb people chat--an essential skill in casual social situations--while smart people discuss. They see small talk as a waste of time and fail to develop those skills, and their social lives suffer as a result.

Tuesday, September 18, 2007

Does Christianity make people soft-hearted? I often wonder how much influence religion really has on people. The General Social Survey asks people how well does the term soft-hearted describe them. Their answers range from "not well" (1) to "very well" (5). Here are the means by religion:


Mean soft-heartedness score

Inter-denominational 4.37
Protestant 4.23
Christian 4.16
Catholic 4.08
Jewish 3.95
None 3.91
Muslim 3.69
Buddhist 3.12

Clearly, Christians are the most compassionate. From knowing people, I would have guessed Jews.

Sunday, September 16, 2007

Homosexuality and IQ: Looking at educational data in a post last year, I showed that men who report exclusively homosexual sex have above average years of schooling. I'm not sure why, but let's take a look at IQ data from the General Social Survey and look at a broader range of sexual orientations (I've limited the analysis to whites since sample sizes are too small for blacks):


Mean IQ

Gay men 104.8
Bisexual men 98.0
Straight men 100.0
Lesbians 102.2
Bisexual women 99.3
Straight women 101.3

First, gay men and lesbians have the highest numbers. In the earlier comments, someone made the reasonable speculation that smart people are simply more likely to admit they are homosexual. (Keep in mind they are simply asked about sexual behavior, not orientation). But shouldn't the numbers also be high for bisexuals as well? They are not. Perhaps smarter people also have the courage and decisiveness to make a clean break from heterosexual behavior? Or, are gay men and lesbians really smarter for someone unknown reason? They seem smart to me.

Friday, September 14, 2007

Hunger in America? Americans are so fat and rich, I assume that no one ever lacks food here. That's not exactly right. According to the General Social Survey, here are the percentages of those who have been unable to purchase food they needed sometime in the past year by sex and ethnicity:


Percent unable to buy food they needed (first men, then women in parentheses)

Blacks 6.9 (9.3)
Mexicans 7.1 (8.5)
American Indians 0.0 (12.3)
Germans 5.6 (5.5)
Scotts 2.4 (8.8)

USA 3.4 (5.6)

English/Welsh 2.4 (3.4)
Italians 0.0 (5.2)
Irish 2.9 (1.4)

For most groups, this hardship hits women more than men. Many of these women are single with dependent children. Few two-parent households are this poor. These are the fruits of feminists telling us that men are not essential to the household: women's natural abilities and Papa Government can do the job.

Monday, September 10, 2007

More on astrology: A reader suggested in the previous post that most of those nutty astrology people are women. Here's the breakdown, according to the General Social Survey:


Percent who think astrology is very, or sort of, scientific

Women 36.1
Men 27.8

And while we're at it:

Blacks 49.4
Whites 28.4

Wow, half of blacks. Moonbeam Obama Mamas is about right.

Sunday, September 09, 2007

Liberals think that astrology is scientific: Liberals enjoy a nice laugh at the anti-science of religious fundamentalists, but the 2006 General Social Survey shows us that they, more than anyone, believe that astrology is scientific. Here is the percentage breakdown:


Percent who believe astrology is very or sort of scientific

Extremely liberal 43.3
Liberal 32.2
Slightly liberal 31.4
Moderate 25.9
Slightly conservative 25.9
Conservative 26.1
Extremely conservative 25.0


Almost half of those who are very liberal believe astrology is good science. So why do we believe what they tell us about anything?

Next, what are the IQ differences?


Mean IQ by view on astrology

It's very scientific 90.1
It's sort of scientific 96.5
It's not scientific at all 101.2

These differences are large. If you're like me, you've heard endless jokes about the Bible-thumping, inbreeding, redneck Bush supporters, but how about those moonbeam Obama Mamas?

Wednesday, September 05, 2007

The sex partner-porn correlation: positive or negative?

Men

Women

Is erotica used the most when a guy has no other option, or do porn and partners go hand-in-hand (pardon the pun)? The two tables above summarize General Social Survey data on whether you have seen at least one x-rated movie in the past year (y-axis) and your number of sex partners over the same time period (x-axis--0,1,2,3,4,5-10,11-20,21-100 partners from left to right). Ages range from 18 to 30. For both sexes, celibates are the least likely to view porn, and the probability peaks (or climaxes, perhaps?) for those with 5-10 partners. Single, religious folks might abstain from porn as well as sex, but there is evidence here that people vary a great deal in their sex drives. Some people seem to need very little sexual pleasure, while others can't get enough.

Monday, September 03, 2007

Ignore your sociology professor who comments on blogs: A sociologist commented in an earlier post that married women are, on average, more likely to be depressed than unmarried women. I'm not sure if he means never-married women or all unmarried women of all types, but either way the General Social Survey says he's wrong. Here are the percent of women by marital status who felt depressed in the past 30 days, either some, a good bit of, most, or all of the time:


Percent of women feeling depressed

Married 26.6
Never married 33.2
Separated 58.9
Divorced 23.7
Widowed 45.0

Here we have another sociologist rattling off facts that make marriage look bad that are false. I can understand how a discipline could get wrong results because of study flaws, but isn't it funny how errors always somehow support the liberal/feminist view?

Are gun owners mentally ill?

  Some anti-gun people think owning a gun is a sign of some kind of mental abnormality. According to General Social Survey data, gun owners ...