Jussie Smollett is just the most recent case of the common phenomenon of minorities orchestrating a hate hoax. This raises the more general question whether racial/ethnic/religious groups differ in how much they value honesty. General Social Survey respondents (all living in America) were asked how much they prioritize various qualities in children. One of the qualities is honesty. Answers ranged from "most desirable" (5) to "least desirable (1)."
I calculated means for various groups (N = 6,279):
Mean Honesty Score
Filipino 4.28
Japanese 4.25
Finnish 4.21
Portuguese 4.19
Dutch 4.15
Swiss 4.15
French Canadian 4.14
English/Welsh 4.12
Irish 4.12
Scotland 4.12
German 4.10
Chinese 4.08
Czech 4.08
French 4.08
Asian Indian 4.08
Total Sample 4.08
Danish 4.06
Norwegian 4.05
Italian 4.02
Austrian 4.00
Lithuanian 3.97
Swedish 3.95
American Indian 3.92
Belgian 3.92
Polish 3.92
Spanish 3.92
Jewish 3.90
Hungarian 3.87
Russian 3.79
Romanian 3.79
Black 3.78
Mexican 3.76
West Indian 3.65
Greek 3.47
Certain minorities -- Jews, blacks, Mex-Ams, and West Indians -- have low honesty scores. The difference between the most honest (Filipinos) and least honest (Greeks) is close to one standard deviation, a very large difference.
There is a tendency for southern and eastern Europeans to value honesty less, while northwestern Europeans and Asians tend to have higher means (though there are exceptions). (I didn't have enough cases of Muslims or Arabs to calculate estimates.)
Friday, February 22, 2019
Saturday, February 16, 2019
Data: Are athletes smarter or dumber than others?
There are positive correlations between IQ and both longevity and height. Many genes underlie these traits -- it looks like there are health-promoting genes that manifest themselves not only through a long life but perhaps a better functioning brain and ending up taller. And a smart/tall/long-lived person might also have a comparatively small number of mutations that work against health.
Does being an athlete fit in with the rest of these traits? One might expect height and athleticism to be correlated simply because popular sports like basketball and football favor bigger people. How about IQ and being a good athlete? Here are the correlations for IQ and self-rated athletic ability (GSS):
White males (n = 440) -.05
White females (n = 553) .01
Black males (n = 74) -.09
Black females (n = 103) -.14
For all demographic groups, IQ and athletic ability are either not correlated or a negatively correlated. It does not appear to be the case that there are genes that promote both at the same time (or that subtract from both simultaneously).
Does being an athlete fit in with the rest of these traits? One might expect height and athleticism to be correlated simply because popular sports like basketball and football favor bigger people. How about IQ and being a good athlete? Here are the correlations for IQ and self-rated athletic ability (GSS):
White males (n = 440) -.05
White females (n = 553) .01
Black males (n = 74) -.09
Black females (n = 103) -.14
For all demographic groups, IQ and athletic ability are either not correlated or a negatively correlated. It does not appear to be the case that there are genes that promote both at the same time (or that subtract from both simultaneously).
Thursday, February 14, 2019
Data: Do brains get you more sex?
Evolutionary psychologist Geoffrey posted the claim on Twitter recently that human cognitive abilities evolved to attract sexual partners. Greg Cochran responded that there is no evidence that sexual selection has been a significant driver of mental abilities.
Do intelligent people get more sex? And bottom line: do they end up with more children? The General Social Survey measures IQ with a vocabulary quiz, so we're measuring verbal ability, a form of intelligence Miller would think is more important for courting than, say, math ability. I'll focus on ages 18-35 since this is a critical time for sexual competition, and frequency varies with age. Here's a graph of the frequency of sex over the past year (GSS, whites, N = 12,757):

Sexual frequency peaks for men at a mean IQ of 98. The mean is 3.8 -- 3 means two or three times per month, and 4 means weekly.
Sexual frequency drops off for higher IQ mean, but then it reverses for men in the highest IQ category. Their average is 3.7.
(Notice how the lowest IQ women have the most sex by far.)
What about kids? We've already documented that high IQ women have fewer kids, but let's focus on men. This graph is for whites ages 45-60:

For men, peak family size is for those with IQs of 77. Men at the highest IQ level average fewer children than almost any other group.
There's little evidence here for a verbal IQ payoff.
Do intelligent people get more sex? And bottom line: do they end up with more children? The General Social Survey measures IQ with a vocabulary quiz, so we're measuring verbal ability, a form of intelligence Miller would think is more important for courting than, say, math ability. I'll focus on ages 18-35 since this is a critical time for sexual competition, and frequency varies with age. Here's a graph of the frequency of sex over the past year (GSS, whites, N = 12,757):

Sexual frequency peaks for men at a mean IQ of 98. The mean is 3.8 -- 3 means two or three times per month, and 4 means weekly.
Sexual frequency drops off for higher IQ mean, but then it reverses for men in the highest IQ category. Their average is 3.7.
(Notice how the lowest IQ women have the most sex by far.)
What about kids? We've already documented that high IQ women have fewer kids, but let's focus on men. This graph is for whites ages 45-60:

For men, peak family size is for those with IQs of 77. Men at the highest IQ level average fewer children than almost any other group.
There's little evidence here for a verbal IQ payoff.
Tuesday, February 12, 2019
Data: Do religious men have larger families? Do religious people idealize larger families?
We saw in the last post that religious women are having more babies than women who never go to church. What about men? Here a graph for number of children for men ages 45-60 (GSS, N = 1,251):

The pattern for men is even clearer than for women: guys who attend more than once a week have a much higher mean (2.38) than those who never go (1.61). That's roughly half of a standard deviation difference.
Is this religiosity-fertility link explained at all by differences in attitudes? Do religious people want more kids? Look at the graph for the same age ranges (GSS, N = 2,173):

Males are green, and females are purple (I'm a dude, so I won't try to give more precise colors).
There is a small tendency for more religious people to idealize larger families. It seems too small to explain much of the reason why the religious have bigger families. It's probably due to getting married earlier and less willingness to get an abortion if you get a surprise.
NOTE: You have read an updated version. The earlier version had the error of leaving in cases of those who answered "whatever number people want," cases that were scored an 8. The results you see above omit these cases (about 6% of the sample).

The pattern for men is even clearer than for women: guys who attend more than once a week have a much higher mean (2.38) than those who never go (1.61). That's roughly half of a standard deviation difference.
Is this religiosity-fertility link explained at all by differences in attitudes? Do religious people want more kids? Look at the graph for the same age ranges (GSS, N = 2,173):

Males are green, and females are purple (I'm a dude, so I won't try to give more precise colors).
There is a small tendency for more religious people to idealize larger families. It seems too small to explain much of the reason why the religious have bigger families. It's probably due to getting married earlier and less willingness to get an abortion if you get a surprise.
NOTE: You have read an updated version. The earlier version had the error of leaving in cases of those who answered "whatever number people want," cases that were scored an 8. The results you see above omit these cases (about 6% of the sample).
Monday, February 11, 2019
Data: The end of religion? Maybe not.
Social thinkers have been predicting the end of religion for many decades. For example, Auguste Comte (1798-1857) predicted that religious faith would decline as scientific knowledge spread.
Over the past two centuries, religion has proven to be more resilient than thought, but there has been a serious decline in regular church attendance in the US in recent decades, and confidence in the existence of God has slipped some, too.
Modernists like Comte were not aware that at least one powerful factor might work against their hopes of a secular world: genes. Studies have found that religiosity is influenced significantly by genetic differences.
And there's a related factor: the correlation between religious involvement and family size. Look at current data for American women (General Social Survey, women ages 40-55, N= 1,441):

Women who never go to church average 1.92 children, while those who go more than once a week have a mean of 2.48 offspring. The gap between the two groups is about four-tenths of a standard deviation, a medium-size difference.
Notice how the least fertile women (1.66 kids) attend once per year. (I'll document in a future post that atheist women have more kids than agnostics.)
Religious people tend to be more conscientious and agreeable than the irreligious, and fertility differences are favoring these genetically-influenced traits.
If the greater fertility of religious women turns out to be a long-term trend, evolution might work against secularization. Combine this with the mass movement of religious Muslims, sub-Saharan Africans, and Hispanics to the developed world, and Comte's vision might be undermined.
Over the past two centuries, religion has proven to be more resilient than thought, but there has been a serious decline in regular church attendance in the US in recent decades, and confidence in the existence of God has slipped some, too.
Modernists like Comte were not aware that at least one powerful factor might work against their hopes of a secular world: genes. Studies have found that religiosity is influenced significantly by genetic differences.
And there's a related factor: the correlation between religious involvement and family size. Look at current data for American women (General Social Survey, women ages 40-55, N= 1,441):

Women who never go to church average 1.92 children, while those who go more than once a week have a mean of 2.48 offspring. The gap between the two groups is about four-tenths of a standard deviation, a medium-size difference.
Notice how the least fertile women (1.66 kids) attend once per year. (I'll document in a future post that atheist women have more kids than agnostics.)
Religious people tend to be more conscientious and agreeable than the irreligious, and fertility differences are favoring these genetically-influenced traits.
If the greater fertility of religious women turns out to be a long-term trend, evolution might work against secularization. Combine this with the mass movement of religious Muslims, sub-Saharan Africans, and Hispanics to the developed world, and Comte's vision might be undermined.
Wednesday, February 06, 2019
Data: The most athletic women have the fewest kids
Now that I've got a little more confidence that self-rated athletic ability has some validity to it (I also observed that it drops markedly with age), I looked to see if athletic people have fewer children. Here's the graph for women ages 40-55 (General Social Survey, N = 401):

American women who say that "athletic" describes them very well average only 1.58 children, while all the less athletic groups have roughly 2.1 kids.
What about men? Here's a graph for them (N = 317):

With men, we see a U-shaped relationship: the very athletic group has a mean of 2.39 offspring, and the least athletic men average 2.31 kids. The average athletic group has the smallest families: a mean of only 1.66 kids.
We could interpret this pattern to mean that highly athletic men are more attractive to women and consequently have more mating opportunities, while the least athletic tend to be low testosterone men who are highly committed to family, which is an alternative path to a large family.
The overall results suggest a mixed trend. What sticks out to me is that athleticism among women shows that same dysgenic trend with see with traits like IQ, education, and health: the top scoring females consistently have the fewest kids.
And let's not forget the study I linked to that found that athletic performance is highly influenced by genes (heritability = .66).

American women who say that "athletic" describes them very well average only 1.58 children, while all the less athletic groups have roughly 2.1 kids.
What about men? Here's a graph for them (N = 317):

With men, we see a U-shaped relationship: the very athletic group has a mean of 2.39 offspring, and the least athletic men average 2.31 kids. The average athletic group has the smallest families: a mean of only 1.66 kids.
We could interpret this pattern to mean that highly athletic men are more attractive to women and consequently have more mating opportunities, while the least athletic tend to be low testosterone men who are highly committed to family, which is an alternative path to a large family.
The overall results suggest a mixed trend. What sticks out to me is that athleticism among women shows that same dysgenic trend with see with traits like IQ, education, and health: the top scoring females consistently have the fewest kids.
And let's not forget the study I linked to that found that athletic performance is highly influenced by genes (heritability = .66).
Tuesday, February 05, 2019
Data: Sex and race differences in self-rated athletic ability
One study of athletic performance put heritability at .66. In plain English, two-thirds of the differences in athletic ability are explained by genetic differences.
General Social Survey participants were asked to rate how athletic they are on a scale from 1 to 5. I calculated the means for sex and race combinations (N = 2,373):

Black men rate themselves as most athletic with a mean of 3.57. White women (2.58) and women of some other race (2.56) come in at the bottom. The gap between black men and other-race women is nine-tenths of a standard deviation (SD) -- a big difference.
If we focus on just men, the black-white difference is one-third of an SD -- a small advantage for black men.
The biggest within-race gap is among blacks: the male advantage over females is three-quarters of an SD. The graph doesn't show the overall sex difference: it's over half of an SD.
While it's difficult to rate oneself objectively, these self-ratings seem to have some validity.
General Social Survey participants were asked to rate how athletic they are on a scale from 1 to 5. I calculated the means for sex and race combinations (N = 2,373):

Black men rate themselves as most athletic with a mean of 3.57. White women (2.58) and women of some other race (2.56) come in at the bottom. The gap between black men and other-race women is nine-tenths of a standard deviation (SD) -- a big difference.
If we focus on just men, the black-white difference is one-third of an SD -- a small advantage for black men.
The biggest within-race gap is among blacks: the male advantage over females is three-quarters of an SD. The graph doesn't show the overall sex difference: it's over half of an SD.
While it's difficult to rate oneself objectively, these self-ratings seem to have some validity.
Sunday, February 03, 2019
Data: Survival of the fattest?
We saw in a recent post that the women with poor health have the most kids. Is this true for heavy women, too? Yes, it is: look at this graph (General Social Survey, self-reported weight, N = 200):

Women with one child are the lightest group with a mean of 165.6 pounds. Compare this to the heaviest group: Women with seven children weigh an average of 208.5 pounds. The difference is roughly one standard deviation -- huge, no pun intended.
Of course, it's hard for a woman to lose the weight she gains from being pregnant, but it is also possible that genes underlie both weight and fertility.
For example, perhaps women who score low on conscientiousness (self-discipline, long-term planning) lack control over both eating and fertility.
Americans are likely to get fatter and fatter as the generations go by. If civilization eventually collapses under all the dysgenic trends I have been documenting lately, these fat Americans might finally lose weight due to food shortages.
UPDATE: Readers might suspect that a respondent's weight is due to her height, and perhaps tall women are having more babies. I checked: fertility does not vary by height.

Women with one child are the lightest group with a mean of 165.6 pounds. Compare this to the heaviest group: Women with seven children weigh an average of 208.5 pounds. The difference is roughly one standard deviation -- huge, no pun intended.
Of course, it's hard for a woman to lose the weight she gains from being pregnant, but it is also possible that genes underlie both weight and fertility.
For example, perhaps women who score low on conscientiousness (self-discipline, long-term planning) lack control over both eating and fertility.
Americans are likely to get fatter and fatter as the generations go by. If civilization eventually collapses under all the dysgenic trends I have been documenting lately, these fat Americans might finally lose weight due to food shortages.
UPDATE: Readers might suspect that a respondent's weight is due to her height, and perhaps tall women are having more babies. I checked: fertility does not vary by height.
Saturday, February 02, 2019
No surprise: Americans in the best position to have a large family are least likely to do so
A good income is associated with positive characteristics like industriousness and intelligence, traits that are strongly influenced by genes. High-income adults are obviously in the best position to have large families. Do they? Look at the graph (General Social Survey, 2010-2016, women ages 40-55, household income in 1986 dollars, N = 1,325):

While women with two children have higher incomes than those with no children, income tends to fall as family size increases beyond two kids. Compared to families with eight or more kids, two-child families earn more than double the household income.
Here's the graph for men ages 45-60 (N = 1,170):

We see a similar pattern for men, although the income drop beyond two kids is perhaps not as steep as for women. (Don't make much of the high bar for men with seven kids: it's based on only four cases.)
We're seeing the same kind of pattern again and again: Americans who are in the best position to have a big family are least likely to do so.
With these trends, the long-term future will go to the people on the bottom of American society -- the people who have the least genetic potential.

While women with two children have higher incomes than those with no children, income tends to fall as family size increases beyond two kids. Compared to families with eight or more kids, two-child families earn more than double the household income.
Here's the graph for men ages 45-60 (N = 1,170):

We see a similar pattern for men, although the income drop beyond two kids is perhaps not as steep as for women. (Don't make much of the high bar for men with seven kids: it's based on only four cases.)
We're seeing the same kind of pattern again and again: Americans who are in the best position to have a big family are least likely to do so.
With these trends, the long-term future will go to the people on the bottom of American society -- the people who have the least genetic potential.
Friday, February 01, 2019
Data: Mentally ill women have the most kids
We saw in the last post that women with poor overall health have more kids than healthy women. This is a bad sign for the long-term health of America. But what about mental health?
The General Social Survey asked respondents, "Now thinking about your mental health, which includes stress, depression, and problems with emotions, for how many days during the past 30 days was your mental health not good?"
Here is the mean number of bad mental health days listed by number of offspring for women ages 40-55:

The General Social Survey asked respondents, "Now thinking about your mental health, which includes stress, depression, and problems with emotions, for how many days during the past 30 days was your mental health not good?"
Here is the mean number of bad mental health days listed by number of offspring for women ages 40-55:

Childless women average 3.5 bad days, while women with eight or more kids have a mean of 6.0 bad days.
Now it's possible that having more children to raise might make one crazy -- I have six kids myself and can testify that it ain't easy -- but it might be the case that people with mental health issues might have less control over their fertility. The large family size means the next generation has a greater number of genes linked to mental illness, and over many generations, you get a pretty crazy population.
In pre-modern times, mental illness would work against survival and mating success, but under modern conditions, we see the mentally healthy making every excuse against having kids, while people who simply don't have it together are reproducing like bunnies.
A perfect example of the current mess is a colleague of mine. She is tall, beautiful, athletic, healthy as a horse, and very smart (as least as smart as a progressive can be). She is also nurturing and is exactly the kind of person who should be having kids. But since the planet is going to melt at any moment, she doesn't want children. So instead of having a family, she and her husband help the environment by jetting to exotic places every other weekend. Not good.
Thursday, January 31, 2019
Data: The healthiest women have the fewest kids
Research shows that more than one-third of the variation in self-reported health is due to genetic differences. Do healthy Americans have most of the kids, so future generations will trend toward good health? The answer is, no. Look that this graph that shows the current number of offspring for women ages 40-55 (General Social Survey, N = 965):

Women with excellent health average 2.08 children. Those with poor health have a mean of 2.32 kids. Now the gap is only small (one-sixth of a standard deviation), but it's enough of a difference to have an impact over the long-term.
So now we've documented negative fertility trends for IQ, education, and self-reported health.
Liberals obsess over about how people on the bottom of society have got it so bad (they exclude poor, straight white men, of course), but in evolutionary terms, the bottom is made up of winners.

Women with excellent health average 2.08 children. Those with poor health have a mean of 2.32 kids. Now the gap is only small (one-sixth of a standard deviation), but it's enough of a difference to have an impact over the long-term.
So now we've documented negative fertility trends for IQ, education, and self-reported health.
Liberals obsess over about how people on the bottom of society have got it so bad (they exclude poor, straight white men, of course), but in evolutionary terms, the bottom is made up of winners.
Monday, January 28, 2019
Data: Current trends might be selecting for low self-discipline
In my view, people in the human biodiversity (HBD) community have a tendency to focus on the importance of IQ to the exclusion of other traits. Don't get me wrong: general intelligence is IMPORTANT, but so are traits like conscientiousness.
One reason why we don't write much about personality traits is that the science is not as developed. We typically have to rely on self-report data to measure personality, and such an approach has obvious limitations.
I agree with the view that educational level reflects conscientiousness as well as intelligence. It's takes planning and self-discipline to stay in school and to spend so much time learning about topics that only we nerds find interesting.
Here's a bar graph depicting the current mean number of offspring for women ages 40-55 by years of education completed (General Social Survey, N = 1,443):

I assume that people with only a few years of education are immigrants from countries where this sort of thing is common. Women with less than a high school education average more than three kids. Compare this to the mean of 1.4 kids for those with 20 years of schooling.
Consciousness as well as IQ are heritable, so if I'm right that educational level reflects both, current social trends are selecting for low intelligence AND low self-discipline. Not good.
One reason why we don't write much about personality traits is that the science is not as developed. We typically have to rely on self-report data to measure personality, and such an approach has obvious limitations.
I agree with the view that educational level reflects conscientiousness as well as intelligence. It's takes planning and self-discipline to stay in school and to spend so much time learning about topics that only we nerds find interesting.
Here's a bar graph depicting the current mean number of offspring for women ages 40-55 by years of education completed (General Social Survey, N = 1,443):

I assume that people with only a few years of education are immigrants from countries where this sort of thing is common. Women with less than a high school education average more than three kids. Compare this to the mean of 1.4 kids for those with 20 years of schooling.
Consciousness as well as IQ are heritable, so if I'm right that educational level reflects both, current social trends are selecting for low intelligence AND low self-discipline. Not good.
Thursday, January 24, 2019
Data: Compared to highly intelligent American women, mentally disabled women have twice the number of kids
Now that we've established that US women differ a great deal in the number of children they have, let's look a current dysgenic trends. This graph shows the mean number of offspring for all women ages 40-55 listed by IQ level (N = 921):
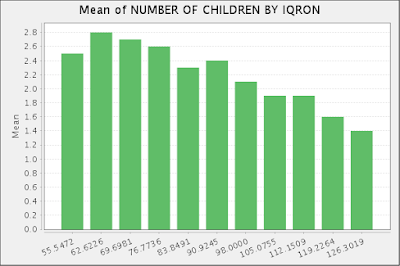
The pattern is no surprise, but it still stings me to see it. Women with IQs of 62.6 average 2.75 kids, while the mean for the highest IQ category (126.3) is 1.44 offspring.
Women below the line for mental disability have families almost twice as large as our most intelligent women. This dysgenic trend has persisted for some time, and it means that each generation has a little less genetic potential for intelligence. Not good.
UPDATE: Once in a while, people ask me what I like to do in my free time. My answer is, "to document the decline of the United States of America."

The pattern is no surprise, but it still stings me to see it. Women with IQs of 62.6 average 2.75 kids, while the mean for the highest IQ category (126.3) is 1.44 offspring.
Women below the line for mental disability have families almost twice as large as our most intelligent women. This dysgenic trend has persisted for some time, and it means that each generation has a little less genetic potential for intelligence. Not good.
UPDATE: Once in a while, people ask me what I like to do in my free time. My answer is, "to document the decline of the United States of America."
Wednesday, January 23, 2019
Data: No, evolution has not come to an end because all women have two kids
I read a tweet quoting Richard Lewontin the other day (can't find the article -- I'd love a copy if someone has one) that suggested that perhaps evolution was coming to an end in modern societies because few people die until they're old, and a model was emerging where everyone has two kids, effectively creating a new generation just like the last.
I hope I read that wrong because it's simply stupid. It's been more than 40 years since Lewontin presented the idea, so the Two-Child Model should have become even more solidified in US society. Look at this graph to see the current distribution of family size for women ages 40-55:

Does everyone have two kids? Hardly. The mean is 2.12, while the standard deviation (SD) is 1.49. One way to interpret SD is to say that if we randomly grabbed two American women in the 40-55 age range, we would expect them to differ in number of children by 1 1/2 kids. (No jokes about half a kid.)
With a normal distribution (known as the "bell curve"), the standard deviation is about 1/6 of the mean, but with this family size variable, the SD is 70% of the mean. In plain English, women are all over the map in terms of how many babies they have.
Some women (and their partners) are contributing much more genetically to the next generation, and since most traits are heritable, they are shifting the distribution of traits. That's called evolution, and it's alive and well.
I hope I read that wrong because it's simply stupid. It's been more than 40 years since Lewontin presented the idea, so the Two-Child Model should have become even more solidified in US society. Look at this graph to see the current distribution of family size for women ages 40-55:

Does everyone have two kids? Hardly. The mean is 2.12, while the standard deviation (SD) is 1.49. One way to interpret SD is to say that if we randomly grabbed two American women in the 40-55 age range, we would expect them to differ in number of children by 1 1/2 kids. (No jokes about half a kid.)
With a normal distribution (known as the "bell curve"), the standard deviation is about 1/6 of the mean, but with this family size variable, the SD is 70% of the mean. In plain English, women are all over the map in terms of how many babies they have.
Some women (and their partners) are contributing much more genetically to the next generation, and since most traits are heritable, they are shifting the distribution of traits. That's called evolution, and it's alive and well.
Tuesday, January 22, 2019
Data: Jewish women with advanced degrees have more kids than their white gentile counterparts
Steve Sailer speculated on Twitter yesterday that "American Jewish total fertility rates are higher than for white gentiles of similar education level and location." The General Social Survey can help a little here if we are willing to use data from 2000 to 2016. I calculated the number of offspring for white women ages 40-55. There aren't enough cases to look at Jewish women with less than a four-year degree, or to look at location:
Total number of offspring by religion
Four-year degree (N = 628)
Jewish 1.30
Protestant 1.72
Catholic 1.75
Graduate degree (N = 346)
Jewish 1.96
Protestant 1.49
Catholic 1.62
At the bachelor's level, Jewish is fertility is lower than of white gentiles, but this reverses at the graduate degree level. It's an atypical, eugenic trend to see Jewish women with graduate degree having, on average, 2/3 more kids than Jewish women with a four-year degree.
It's been about a decade since I analyzed current fertility patterns in the US, so I plan to do that in the next few posts, and to look at correlates I've never examined before.
Total number of offspring by religion
Four-year degree (N = 628)
Jewish 1.30
Protestant 1.72
Catholic 1.75
Graduate degree (N = 346)
Jewish 1.96
Protestant 1.49
Catholic 1.62
At the bachelor's level, Jewish is fertility is lower than of white gentiles, but this reverses at the graduate degree level. It's an atypical, eugenic trend to see Jewish women with graduate degree having, on average, 2/3 more kids than Jewish women with a four-year degree.
It's been about a decade since I analyzed current fertility patterns in the US, so I plan to do that in the next few posts, and to look at correlates I've never examined before.
Saturday, January 19, 2019
Data: Lighter blacks tend to be smarter
Recently, I documented that of the four racial groups examined -- whites, Hispanics, Asian Indians, and East Asians-- four showed a positive correlation between lighter skin and IQ. But what about blacks?
This graph shows mean IQ for blacks born in the US at increasing dark skin tones (as rated by General Social Survey interviewers, N = 658). I am using skin tone as a rough measure of the degree of European ancestry:

Tones 6-10, especially 10, have lower average IQs than tones 1-5. The difference between level 1 (IQ = 93.6) and level 10 (IQ = 86.4) is well over half a standard deviation.
So blacks with more European ancestry tend to have higher IQs. The explanation that light-skinned blacks receive better treatment than dark blacks is unconvincing. When someone of another race encounters a black person, you say "black person" to yourself, not "light-skinned black person." And anyway, there's no evidence that poor treatment makes somebody dumber. If it did, Jewish Holocaust survivors would be morons, not people with above average IQs.
This graph shows mean IQ for blacks born in the US at increasing dark skin tones (as rated by General Social Survey interviewers, N = 658). I am using skin tone as a rough measure of the degree of European ancestry:

Tones 6-10, especially 10, have lower average IQs than tones 1-5. The difference between level 1 (IQ = 93.6) and level 10 (IQ = 86.4) is well over half a standard deviation.
So blacks with more European ancestry tend to have higher IQs. The explanation that light-skinned blacks receive better treatment than dark blacks is unconvincing. When someone of another race encounters a black person, you say "black person" to yourself, not "light-skinned black person." And anyway, there's no evidence that poor treatment makes somebody dumber. If it did, Jewish Holocaust survivors would be morons, not people with above average IQs.
Thursday, January 17, 2019
Data: Moderately religious whites are the most ethnocentric
We saw in the last post that religious blacks, compared to their irreligious counterparts, say their racial identity is more important to them. Does this pattern apply to whites?
I suspect the General Social Survey question is not interpreted the same by whites as blacks. It asks about ethnic identity, and I would guess whites are more likely to respond with something like, "Sure my Irishness is important." Only a certain percentage probably interpret the question racially.
Anyway, here's what we get when we calculate mean ethnocentricity scores by church attendance (N = 2,167):

Being ethnocentric peaks for whites who attend 2-3 times per month. By contrast, it bottoms out among those who never go to church AND those who go more than weekly.
Racially-minded whites often say that Christianity is a problem since it encourages color-blindism, but that only seems to be the case for the small share of highly religious people. And the complete absence of religious activity is correlated with less ethnocentrism. Moderate religiosity seems to go hand-in-hand with ethnic loyalty.
By the way, the difference between the top and bottom group is roughly 40% of standard deviation, so it's a moderate-size gap.
NOTE: Notice how I tend to handle these topics as a scholar should, while actual scholars do not. I use fairly neutral terms like "ethnocentric" for both blacks and whites, while elite scholars use terms like "black pride" and "racial self-esteem" for blacks, and when the same question is analyzed for whites, terms like "hatred, "racism," "white supremacism," and "hate groups" are used. These "scholars" are frauds and should be ashamed of themselves.
I suspect the General Social Survey question is not interpreted the same by whites as blacks. It asks about ethnic identity, and I would guess whites are more likely to respond with something like, "Sure my Irishness is important." Only a certain percentage probably interpret the question racially.
Anyway, here's what we get when we calculate mean ethnocentricity scores by church attendance (N = 2,167):

Being ethnocentric peaks for whites who attend 2-3 times per month. By contrast, it bottoms out among those who never go to church AND those who go more than weekly.
Racially-minded whites often say that Christianity is a problem since it encourages color-blindism, but that only seems to be the case for the small share of highly religious people. And the complete absence of religious activity is correlated with less ethnocentrism. Moderate religiosity seems to go hand-in-hand with ethnic loyalty.
By the way, the difference between the top and bottom group is roughly 40% of standard deviation, so it's a moderate-size gap.
NOTE: Notice how I tend to handle these topics as a scholar should, while actual scholars do not. I use fairly neutral terms like "ethnocentric" for both blacks and whites, while elite scholars use terms like "black pride" and "racial self-esteem" for blacks, and when the same question is analyzed for whites, terms like "hatred, "racism," "white supremacism," and "hate groups" are used. These "scholars" are frauds and should be ashamed of themselves.
Wednesday, January 16, 2019
Data: Black conservatives are MORE ethnocentric
If you didn't know better, you might assume that blacks who are conservative or religious might be less race conscious than their black counterparts. You might assume that religion and conservatism might nudge blacks toward the ideal of color blindness, or that loyalty to one group might reduce loyalty to another. Wrong.
The General Social Survey asked blacks on a scale from 1 to 4 how important their ethnicity was to their sense of who they are. Here is a graph showing means scores of this question by political orientation:

While ethnocentrism does not rise smoothly with conservatism, blacks who describe themselves as extremely conservative are the most black-centric group. So don't think that a black right-winger wants to forget about race.
Let's look a ethnocentrism by church attendance:

The effect is not strong, but there is a tendency for more religious blacks to focus more on race identity, rather than the fact we are all children of God.
How do we explain this (admittedly weak) pattern? (Keep in mind that mean ethnocentrism is so high for blacks of any category, there isn't much variation to explain.) Perhaps it's due to a liberal tendency to see oneself as a citizen of the world, while conservatives might be more comfortable with local loyalties.
The General Social Survey asked blacks on a scale from 1 to 4 how important their ethnicity was to their sense of who they are. Here is a graph showing means scores of this question by political orientation:

While ethnocentrism does not rise smoothly with conservatism, blacks who describe themselves as extremely conservative are the most black-centric group. So don't think that a black right-winger wants to forget about race.
Let's look a ethnocentrism by church attendance:

The effect is not strong, but there is a tendency for more religious blacks to focus more on race identity, rather than the fact we are all children of God.
How do we explain this (admittedly weak) pattern? (Keep in mind that mean ethnocentrism is so high for blacks of any category, there isn't much variation to explain.) Perhaps it's due to a liberal tendency to see oneself as a citizen of the world, while conservatives might be more comfortable with local loyalties.
Tuesday, January 15, 2019
Data: What predicts skepticism about God best--scientific knowledge, IQ, or education?
Many 19th century thinkers believed that religion would gradually wither away as industrialization and scientific knowledge spread. Religious belief has proven to be more stubborn than they thought, perhaps because they didn't realize that it has a genetic component, but how much of an antagonism do we see nowadays between science and belief?
The General Social Survey (GSS) asks people how much confidence they have in the existence of God with answers ranging from "don't believe" to "know there is a God." The survey also asked ten questions that tap scientific knowledge. I added up the correct answers and estimated the relationship between the this and belief with OLS regression (N = 4,542), and the unstandardied coefficient is -.195. Standardized is -.265. In plain English, scientific knowledge predicts skepticism with some accuracy.
Is this link due simply to IQ? In other words, do smart people seek out scientific knowledge and at the same time come to look on the existence of God with skepticism? The answer is, not really. When I add IQ to the model, it does significantly predict skepticism, but the effect is weak (beta = -.051) and the coefficient for scientific knowledge only drops a little from -.195 to -.187.
How about education? People learn more science as they get educated, and perhaps school teaches skepticism about God. When I add years of education to the model, it is related to more skepticism only weakly (beta = -.052), and the science coefficient only drops from -.187 to -.178. By the way, the effect of IQ on skepticism falls to non-significance with the addition of education to the model. In other words, IQ is unrelated to skepticism when you take educational level into account.
So, when you consider knowledge of science, IQ, and education, the factor that really seems to matter for belief is science. (Of course, causal direction is not clear here. Religious people may tend to stay away from science since they sense it is antagonistic to their beliefs.)
The General Social Survey (GSS) asks people how much confidence they have in the existence of God with answers ranging from "don't believe" to "know there is a God." The survey also asked ten questions that tap scientific knowledge. I added up the correct answers and estimated the relationship between the this and belief with OLS regression (N = 4,542), and the unstandardied coefficient is -.195. Standardized is -.265. In plain English, scientific knowledge predicts skepticism with some accuracy.
Is this link due simply to IQ? In other words, do smart people seek out scientific knowledge and at the same time come to look on the existence of God with skepticism? The answer is, not really. When I add IQ to the model, it does significantly predict skepticism, but the effect is weak (beta = -.051) and the coefficient for scientific knowledge only drops a little from -.195 to -.187.
How about education? People learn more science as they get educated, and perhaps school teaches skepticism about God. When I add years of education to the model, it is related to more skepticism only weakly (beta = -.052), and the science coefficient only drops from -.187 to -.178. By the way, the effect of IQ on skepticism falls to non-significance with the addition of education to the model. In other words, IQ is unrelated to skepticism when you take educational level into account.
So, when you consider knowledge of science, IQ, and education, the factor that really seems to matter for belief is science. (Of course, causal direction is not clear here. Religious people may tend to stay away from science since they sense it is antagonistic to their beliefs.)
Saturday, January 12, 2019
Data: Educated immigrants ain't impressive
In a recent tweet, Ann Coulter claimed that H-1B visa holders are not highly skilled like President Trump says but are simply slave labor.
While I can't use GSS data to identify this group of workers, let's look at the vocabulary test scores of immigrants with at least 16 years of total education. I won't call it IQ scores since English is a second language for most immigrants, but I will argue that an immigrant's English vocabulary says something meaningful about him.
Here are the mean vocabulary scores by decade (N = 725):
Mean vocabulary (using an IQ scale)
1970s 109.5
1980s 98.7
1990s 100.9
2000s 97.6
2010s 100.7
We can see that while educated immigrants in the 1970s had good vocabularies, they dropped to the average white score by the 80s, and it has remained in that area since.
This pattern is similar to what we have seen with immigrants in general, and Americans admitted to college or graduate school: mean scores were quite good in the 1970s, but the US then got more egalitarian and lowered standards. Now we take anyone into the country or into the university. This shows that our elites no longer put a premium on quality, but really care about giving goodies (American citizenship, access to universities) to any schmuck who shows up.
UPDATE: If we divide the educated immigrants from this past decade by race, the mean scores are: white 104.5, black 99.5, other 96.6.
While I can't use GSS data to identify this group of workers, let's look at the vocabulary test scores of immigrants with at least 16 years of total education. I won't call it IQ scores since English is a second language for most immigrants, but I will argue that an immigrant's English vocabulary says something meaningful about him.
Here are the mean vocabulary scores by decade (N = 725):
Mean vocabulary (using an IQ scale)
1970s 109.5
1980s 98.7
1990s 100.9
2000s 97.6
2010s 100.7
We can see that while educated immigrants in the 1970s had good vocabularies, they dropped to the average white score by the 80s, and it has remained in that area since.
This pattern is similar to what we have seen with immigrants in general, and Americans admitted to college or graduate school: mean scores were quite good in the 1970s, but the US then got more egalitarian and lowered standards. Now we take anyone into the country or into the university. This shows that our elites no longer put a premium on quality, but really care about giving goodies (American citizenship, access to universities) to any schmuck who shows up.
UPDATE: If we divide the educated immigrants from this past decade by race, the mean scores are: white 104.5, black 99.5, other 96.6.
Friday, January 11, 2019
Data: Nonwhite IQ is falling
If you believe that people basically can't be changed and children are like their parents, you should be concerned with the kinds of people who are coming into the US with plans to stay here for good.
The picture does not look good when we focus on IQ. I typically use a vocabulary test given to participants of the bi-annual General Social Survey. One problem with this measure is that it is biased against people who weren't raised speaking English. For this blog post, let's focus on non-whites who also not black as a rough way to capture people born in this country whose family came to the U.S. in recent decades. It's crude (for example, American Indians get included), but we do what we can. Here is the mean IQ for this group listed by decade:
Mean IQ for nonwhites (blacks excluded, N = 764)
1980s 88.4
1990s 93.0
2000s 94.0
2010s 92.4
(If you're familiar with the GSS, you know surveys were conducted in the 70s, but not enough native-born non-whites were surveyed to be included.) Mean IQ improved for this group for 30 years (80s, 90s, 00s) but that has reversed in this decade.
This is consistent with most of the IQ trends I've looked at recently. This past decade has seen a downturn for every group I've looked at (all whites, English/Welsh, German, Italian, Mexican, East Asian) except for blacks and the Irish.
The cause of the fall in IQ is, I imagine, different for different groups, and I assume that the drop for non-whites (excluding blacks) is due to changes in the mix of immigrants. Whatever the reasons, most trends do not look good for America.
Despite what Nassim Taleb thinks, average IQ predicts quite well how a country performs, and the US seems headed for mediocrity. This, of course, could be reversed if we were picky about who gets to come to America, and if intelligent citizens had more babies, while dull ones had fewer.
The picture does not look good when we focus on IQ. I typically use a vocabulary test given to participants of the bi-annual General Social Survey. One problem with this measure is that it is biased against people who weren't raised speaking English. For this blog post, let's focus on non-whites who also not black as a rough way to capture people born in this country whose family came to the U.S. in recent decades. It's crude (for example, American Indians get included), but we do what we can. Here is the mean IQ for this group listed by decade:
Mean IQ for nonwhites (blacks excluded, N = 764)
1980s 88.4
1990s 93.0
2000s 94.0
2010s 92.4
(If you're familiar with the GSS, you know surveys were conducted in the 70s, but not enough native-born non-whites were surveyed to be included.) Mean IQ improved for this group for 30 years (80s, 90s, 00s) but that has reversed in this decade.
This is consistent with most of the IQ trends I've looked at recently. This past decade has seen a downturn for every group I've looked at (all whites, English/Welsh, German, Italian, Mexican, East Asian) except for blacks and the Irish.
The cause of the fall in IQ is, I imagine, different for different groups, and I assume that the drop for non-whites (excluding blacks) is due to changes in the mix of immigrants. Whatever the reasons, most trends do not look good for America.
Despite what Nassim Taleb thinks, average IQ predicts quite well how a country performs, and the US seems headed for mediocrity. This, of course, could be reversed if we were picky about who gets to come to America, and if intelligent citizens had more babies, while dull ones had fewer.
Tuesday, January 08, 2019
Data: A big drop in IQs for East Asians in the US
As I sit in this McDonald's being served coffee by a middle-aged Filipino man, I'm wondering how East Asian IQ is doing in the US. Here is a graph showing trends since the 1970s (GSS data, US born, N = 107):

Wow, that's a significant drop. In the 1970s, the mean was 108.6. By the 1990s, it fell to 99.3. After an increase to 101.7 in the 2000s, it fell again to a low of 99.0 in this decade.
I assume this drop is due to the increase of southeast Asians (e.g., Filipinos, Vietnamese) -- groups that have lower average IQs than NE Asians (i.e., Japanese, Chinese, Koreans).

Wow, that's a significant drop. In the 1970s, the mean was 108.6. By the 1990s, it fell to 99.3. After an increase to 101.7 in the 2000s, it fell again to a low of 99.0 in this decade.
I assume this drop is due to the increase of southeast Asians (e.g., Filipinos, Vietnamese) -- groups that have lower average IQs than NE Asians (i.e., Japanese, Chinese, Koreans).
Monday, January 07, 2019
Data: The four point Flynn Effect among US blacks (but pay no attention because Taleb says IQ is crap)
According to General Social Survey (GSS) data, both whites and Mexican Americans born in the US have experienced mean IQ drops in the past decade. Is this also true of blacks? Here are the means by decade (N = 3,865):
Mean IQ
1970s 88.0
1980s 89.0
1990s 90.8
2000s 92.1
2010s 92.4
The 70s/80s increase was 1 point; the 80s/90s was up 1.8 points; and it was up 1.3 points for the 90s/00s. The past decade witnessed the smallest increase of 0.3 IQ points. The 1970s-2000s gain is impressive, but lately things seem to be slowing down.
I don't how to explain the trend but suspect that American society might expose blacks and whites (via schools, mass media, etc.) to more similar words used to test vocabularies than in the past.
The typical IQ mean you read about for black Americans is 85, but the black/white verbal IQ gap appears to be smaller: GSS data indicates that in this decade the gap is six-tenths of a standard deviation. Notice how the black mean is a point higher than the 91.5 mean for Mex-Ams reported in a recent post.
Mean IQ
1970s 88.0
1980s 89.0
1990s 90.8
2000s 92.1
2010s 92.4
The 70s/80s increase was 1 point; the 80s/90s was up 1.8 points; and it was up 1.3 points for the 90s/00s. The past decade witnessed the smallest increase of 0.3 IQ points. The 1970s-2000s gain is impressive, but lately things seem to be slowing down.
I don't how to explain the trend but suspect that American society might expose blacks and whites (via schools, mass media, etc.) to more similar words used to test vocabularies than in the past.
The typical IQ mean you read about for black Americans is 85, but the black/white verbal IQ gap appears to be smaller: GSS data indicates that in this decade the gap is six-tenths of a standard deviation. Notice how the black mean is a point higher than the 91.5 mean for Mex-Ams reported in a recent post.
Saturday, January 05, 2019
Data: Average IQ of whites fell one-half point over the past decade
In the last post, we saw saw that Mexican Americans born in the US had a mean IQ that rose from the 1980s to the 2000s, but reversed course since then. It is currently 91.5.
That made me curious about other American groups. Let's start with all whites over the past four decades (GSS Wordsum measure, N = 20, 482):
Mean IQ for whites
1970s 99.2
1980s 99.3
1990s 100.4
2000s 101.1
2010s 100.6
As we saw with Mex-Ams, whites peaked in the 2000s, but then IQ's dropped in the past decade -- one-half a point.
This is consistent with Greg Cochran's claim that the US is undergoing rapid change in genetic potential for IQ due to intelligent people having fewer offspring. It might be decreasing one point per generation.
That made me curious about other American groups. Let's start with all whites over the past four decades (GSS Wordsum measure, N = 20, 482):
Mean IQ for whites
1970s 99.2
1980s 99.3
1990s 100.4
2000s 101.1
2010s 100.6
As we saw with Mex-Ams, whites peaked in the 2000s, but then IQ's dropped in the past decade -- one-half a point.
This is consistent with Greg Cochran's claim that the US is undergoing rapid change in genetic potential for IQ due to intelligent people having fewer offspring. It might be decreasing one point per generation.
Wednesday, January 02, 2019
Data: A negative Flynn Effect among Mexican Americans
About a decade ago, I documented an impressive rise in the mean IQ of Mexican-Americans born in the US. Using GSS data, what is the trend in this decade? Look at the graph (N = 609):

The mean was only 85.0 in the 1970s and 84.7 in the 1980s, but it rose all the way to 94.7 by the 2000s. From this trend, one might get the hope that Mex-Ams might someday converge with the white average of 100.
But it was not to be. The trend has reversed in this decade, and the mean has fallen back down to 91.5.
I don't know how we explain these trends. Dysgenic trends would manifest themselves slowly. We have seen a recent downward turn among several European populations.
The samples sizes for each decade are not large (this decade included 217 people) so some of the trend might be noise.
Assuming the 91.5 average is more or less correct, this is a bad sign for America. A person with an IQ in the low 90s will be unable to do many of the jobs that we need done. Such a population will have more social problems and little high-level achievement.
UPDATE: I looked at all Americans born in the US (N = 25,116) and found a seven-tenths of a point drop in IQ from the last decade to this one.

The mean was only 85.0 in the 1970s and 84.7 in the 1980s, but it rose all the way to 94.7 by the 2000s. From this trend, one might get the hope that Mex-Ams might someday converge with the white average of 100.
But it was not to be. The trend has reversed in this decade, and the mean has fallen back down to 91.5.
I don't know how we explain these trends. Dysgenic trends would manifest themselves slowly. We have seen a recent downward turn among several European populations.
The samples sizes for each decade are not large (this decade included 217 people) so some of the trend might be noise.
Assuming the 91.5 average is more or less correct, this is a bad sign for America. A person with an IQ in the low 90s will be unable to do many of the jobs that we need done. Such a population will have more social problems and little high-level achievement.
UPDATE: I looked at all Americans born in the US (N = 25,116) and found a seven-tenths of a point drop in IQ from the last decade to this one.
Monday, December 31, 2018
Data: Has racism declined over the past few decades?
Despite decades of militant effort to root out racism in America, blacks continue to be concentrated at the bottom rungs of society. Now we all walk on egg shells when it comes to race, so where is the supposed hatred that is keeping blacks down? To save the argument, liberals have shifted and now claim that racism isn't cross-burnings and lynchings; it's sneaky. It's so sneaky, you can't even find it. It's like the Devil: invisible but powerful. It's either hidden in institutional arrangements, or whites are simply faking their goodwill.
There is clear General Social Survey (GSS) evidence that contradicts the view that whites don't talk or act so racist, but the same hatred still lurks in their hearts. I've long argued that one of the few survey measures of racism that has some validity asks participants how warmly they feel toward blacks. At least it's better than BS measures like whether you support racial preferences or not.
GSS participants were asked the warmth question in 2002. Look how mean "coolness" increases with age for southerners (blue) and northerners (red):

People in their 20s would have been born in the 1970s, those in their 30s in the 1960s, etc. People aged 70 and above are noticeably colder than those in their 20s. It's about one-half of a standard deviation difference. And even the elderly group averages a "warm" response. A five would be neutral, but a four is positive. Even whites born in the South in the 1920s like blacks. The US is a racist country? BS. Just the opposite.
Notice how young southerners are a little colder than northerners, but the two regions converge and even flip among the oldest group. In other words, elderly northerners like blacks less than elderly southerners do.
Anyway, I think even most liberals would admit that whites act better now than they did in the 1950s, which is all anyone should worry about anyway. Who cares what's in someone's heart as long as they treat you well? But if we are worried about private sentiments, there is a significant difference between younger and older Americans. (Of course, I'm assuming people develop their feelings when young and then tend to hold on to them throughout adulthood. It is possible that people are warmer when young and get colder as they age.)
By the way, I'm trying to figure out why my cohort, those born in the 60s, appear to be colder than those who are both younger and older. I was in college during the Rodney King riots in 1992, and it did make an impression on me. But I was a liberal, so I found myself making excuses for all the destructive behavior. Perhaps all the violent crime of the late 80s and early 90s left its mark.
There is clear General Social Survey (GSS) evidence that contradicts the view that whites don't talk or act so racist, but the same hatred still lurks in their hearts. I've long argued that one of the few survey measures of racism that has some validity asks participants how warmly they feel toward blacks. At least it's better than BS measures like whether you support racial preferences or not.
GSS participants were asked the warmth question in 2002. Look how mean "coolness" increases with age for southerners (blue) and northerners (red):

People in their 20s would have been born in the 1970s, those in their 30s in the 1960s, etc. People aged 70 and above are noticeably colder than those in their 20s. It's about one-half of a standard deviation difference. And even the elderly group averages a "warm" response. A five would be neutral, but a four is positive. Even whites born in the South in the 1920s like blacks. The US is a racist country? BS. Just the opposite.
Notice how young southerners are a little colder than northerners, but the two regions converge and even flip among the oldest group. In other words, elderly northerners like blacks less than elderly southerners do.
Anyway, I think even most liberals would admit that whites act better now than they did in the 1950s, which is all anyone should worry about anyway. Who cares what's in someone's heart as long as they treat you well? But if we are worried about private sentiments, there is a significant difference between younger and older Americans. (Of course, I'm assuming people develop their feelings when young and then tend to hold on to them throughout adulthood. It is possible that people are warmer when young and get colder as they age.)
By the way, I'm trying to figure out why my cohort, those born in the 60s, appear to be colder than those who are both younger and older. I was in college during the Rodney King riots in 1992, and it did make an impression on me. But I was a liberal, so I found myself making excuses for all the destructive behavior. Perhaps all the violent crime of the late 80s and early 90s left its mark.
Sunday, December 30, 2018
Data: What percentage of Americans are "white nationalists"?
The General Social Survey asks respondents the following: "What about the number of immigrants from Europe? Should it be increased a lot, increased a little, left the same as it is now, decreased a little, or decreased a lot?" People were asked the same about immigrants from Latin America.
These questions enable us to measure a preference for one group or the other. I created a variable that ranges from 1 to 9 where 9 is a person who wants to increase immigration a lot from Europe and decrease it a lot from Latin America. A person who scores a 1 wants a large increase from Latin America and a big decrease from Europe. A person who wants the same level for both groups, regardless of the level, is given a 5, which indicates no preference. All the other numbers indicate milder forms of preference for either one group or the other. So let's show the results by race of the respondent:
Immigration preference (%)
Whites (n = 1,033)
Very strong European 0.1
Strong European 2.6
Moderate European 5.3
Mild European 8.7
No preference 77.1
Mild Latin 5.5
Moderate Latin 0.4
Strong Latin 0.2
Very Strong Latin 0.1
I was pretty sure the most popular score would be "no preference," but there are small percentages of whites who do show a European preference. It's 16.7% of whites that show at least a mild European bias, and I imagine there are more who were unwilling to admit the preference to an interviewer. So conservatively speaking, we can conclude that 17% of whites could be classified as at least mildly Eurocentric. Some might want to put a nastier label on it and say that 17% of whites are white nationalists or white supremacists.
Notice, too, that over 6% of white Americans have a Latin American preference. Let's now turn to black respondents:
Blacks (n = 191)
Very strong European 0.0
Strong European 1.6
Moderate European 4.2
Mild European 4.7
No preference 83.2
Mild Latin 4.7
Moderate Latin 0.5
Strong Latin 0.1
Very Strong Latin 0.0
Blacks are even more likely than whites to not have a preference, but 10.5% have a Euro preference, compared to only 5.3% having at least a mild Latin preference. These numbers are not consistent with blacks viewing Hispanic immigrants as brothers in the fight against whites.
Other Races (n = 77)
Very strong European 0.0
Strong European 7.8
Moderate European 3.9
Mild European 6.5
No preference 68.8
Mild Latin 10.4
Moderate Latin 2.6
Strong Latin 0.0
Very Strong Latin 0.0
You actually have a higher percent of people from other races showing at least some Euro bias than whites: 18.2% to be precise. Slightly over two-thirds report no preference, while 13% have a Latin preference. Keep in mind that many of these "other race" are Hispanics. I would have expected more people from this group to show favoritism to other Latinos.
Overall, there is a noteworthy number of people from each race who are more favorable to immigration by whites than immigration by Hispanics (or at least less unfavorable). So if these people are indeed white nationalists, then we have white nationalists of all colors.
These questions enable us to measure a preference for one group or the other. I created a variable that ranges from 1 to 9 where 9 is a person who wants to increase immigration a lot from Europe and decrease it a lot from Latin America. A person who scores a 1 wants a large increase from Latin America and a big decrease from Europe. A person who wants the same level for both groups, regardless of the level, is given a 5, which indicates no preference. All the other numbers indicate milder forms of preference for either one group or the other. So let's show the results by race of the respondent:
Immigration preference (%)
Whites (n = 1,033)
Very strong European 0.1
Strong European 2.6
Moderate European 5.3
Mild European 8.7
No preference 77.1
Mild Latin 5.5
Moderate Latin 0.4
Strong Latin 0.2
Very Strong Latin 0.1
I was pretty sure the most popular score would be "no preference," but there are small percentages of whites who do show a European preference. It's 16.7% of whites that show at least a mild European bias, and I imagine there are more who were unwilling to admit the preference to an interviewer. So conservatively speaking, we can conclude that 17% of whites could be classified as at least mildly Eurocentric. Some might want to put a nastier label on it and say that 17% of whites are white nationalists or white supremacists.
Notice, too, that over 6% of white Americans have a Latin American preference. Let's now turn to black respondents:
Blacks (n = 191)
Very strong European 0.0
Strong European 1.6
Moderate European 4.2
Mild European 4.7
No preference 83.2
Mild Latin 4.7
Moderate Latin 0.5
Strong Latin 0.1
Very Strong Latin 0.0
Blacks are even more likely than whites to not have a preference, but 10.5% have a Euro preference, compared to only 5.3% having at least a mild Latin preference. These numbers are not consistent with blacks viewing Hispanic immigrants as brothers in the fight against whites.
Other Races (n = 77)
Very strong European 0.0
Strong European 7.8
Moderate European 3.9
Mild European 6.5
No preference 68.8
Mild Latin 10.4
Moderate Latin 2.6
Strong Latin 0.0
Very Strong Latin 0.0
You actually have a higher percent of people from other races showing at least some Euro bias than whites: 18.2% to be precise. Slightly over two-thirds report no preference, while 13% have a Latin preference. Keep in mind that many of these "other race" are Hispanics. I would have expected more people from this group to show favoritism to other Latinos.
Overall, there is a noteworthy number of people from each race who are more favorable to immigration by whites than immigration by Hispanics (or at least less unfavorable). So if these people are indeed white nationalists, then we have white nationalists of all colors.
Saturday, December 29, 2018
Data: How smart are Christian Arabs in the US?
Recently, there was a big Twitter war between a bunch of smart pro-IQ guys (i.e., pro-science), including Stever Sailer, Greg Cochran, and Geoffrey Miller, against the otherwise smart Nassim Nicholas Taleb. Taleb is from a Lebanese Christian family, and a side question that arose from the debate was about the intelligence of Lebanese Christians. Sailer mentioned all the Lebanese billionaires like Carlos Slim as being quite impressive, and most are Christians.
The General Social Survey can help a little here. While it does not ask if you're Lebanese, it does ask if you're Arab, as well as what your religion is. I was able to identify 12 Christian Arabs in the sample who were born in the US. Their mean IQ is 103.5. I've attended church with several Arabs over the years, and they seem like accomplished people.
The General Social Survey can help a little here. While it does not ask if you're Lebanese, it does ask if you're Arab, as well as what your religion is. I was able to identify 12 Christian Arabs in the sample who were born in the US. Their mean IQ is 103.5. I've attended church with several Arabs over the years, and they seem like accomplished people.
Thursday, December 27, 2018
Data: What is the IQ of the average black person with an advanced degree?
We know that colleges have gotten less selective as they have tried to boost the numbers of blacks and Hispanics. (In fact, as higher education has gotten more egalitarian, it has become less selective for all races.) My guess is that mean IQ for blacks of a given degree level has dropped over the past few decades. Here's what GSS data say (N = 3,856):

It looks like I'm right, but only for graduate school. Mean IQ in the 70s was 112, but now it has fallen all the way to 101. For a 4-year degree, the average has hovered around 100.
Two things really strike me. First, the average black with a Master's degree or higher has an IQ close to the average white in the general population. That really needs no comment, but you can imagine what the thesis is going to look like (if a thesis is even required).
Second, a black person with an advanced degree is basically not smarter than one with a bachelor's. Universities are not recruiting a select bunch out of the pool of college graduates. They're selecting on other traits like who thinks a teaching assistantship sounds preferable to a real job.

It looks like I'm right, but only for graduate school. Mean IQ in the 70s was 112, but now it has fallen all the way to 101. For a 4-year degree, the average has hovered around 100.
Two things really strike me. First, the average black with a Master's degree or higher has an IQ close to the average white in the general population. That really needs no comment, but you can imagine what the thesis is going to look like (if a thesis is even required).
Second, a black person with an advanced degree is basically not smarter than one with a bachelor's. Universities are not recruiting a select bunch out of the pool of college graduates. They're selecting on other traits like who thinks a teaching assistantship sounds preferable to a real job.
Wednesday, December 26, 2018
Data: Are Jews the smartest whites?
The human biodiversity community knows that Jews are the smartest whites, but are they, really?
Using the General Social Survey's IQ measure, here are the top five white IQ groups by religion:
Mean IQ (N = 22,242)
Buddhist 110.9
Other Eastern religion 109.4 (n is only 13)
Jewish 108.1
Episcopalian 107.7
Hindu 106.3 (n is only 6)
Jews actually come in third behind Buddhists and whites following other Eastern religions. Plus, Episcopalians are pretty close to Jews. Hindus are smart, on average, too (although we shouldn't make much out of such a small sample).
In case you're curious, whites with no religion have an average IQ of 102.8.
Using the General Social Survey's IQ measure, here are the top five white IQ groups by religion:
Mean IQ (N = 22,242)
Buddhist 110.9
Other Eastern religion 109.4 (n is only 13)
Jewish 108.1
Episcopalian 107.7
Hindu 106.3 (n is only 6)
Jews actually come in third behind Buddhists and whites following other Eastern religions. Plus, Episcopalians are pretty close to Jews. Hindus are smart, on average, too (although we shouldn't make much out of such a small sample).
In case you're curious, whites with no religion have an average IQ of 102.8.
Thursday, December 20, 2018
Data: The verbal IQs of black northerners and especially black and white southerners have risen since the 1970s
The General Social Survey has been giving participants a vocabulary quiz since the 70s. Research indicates that this is a decent proxy for verbal IQ.
Supposedly, education for blacks in the South was awful prior to the civil rights movement. If education makes any difference, perhaps IQ scores of southern blacks have gradually improved since the 1960s. The graph below shows mean IQ per decade for southern (blue line) and northern (red line) blacks (N = 4,435):
 Keep in mind that the sample is all adult blacks, so educational improvements for children would have a very gradual impact on the whole adult population, if any at all. In the 1970s, the gap for the two groups was six IQ points (85 vs. 91). By the 2000s, the gap was down to three points (90 vs. 93).
Notice, too, how the means increased for both groups, especially for southerners, over this period. Perhaps southern schools have gotten better, and some other factor has boosted scores for blacks in both regions. It could be some biological factor like nutrition, or perhaps something like more exposure to mainstream vocabulary words via television. I'm pretty sure the same 10 questions have been used since the beginning, so the quiz hasn't gotten easier.
Here is the graph for whites (N = 24,363):
 Like blacks, whites from the South gained significant IQ points from the 70's to the 2000s; four points to be specific (96 to 100). Northern whites, on the other hand, only gained 6/10's of a point, from 100.6 to 101.2.
It looks like northern blacks and especially southerners of both races benefited from something.
UPDATE: The South has gotten to be a more attractive region post-civil rights era. Perhaps part of the story is intelligent black and white northerners moving south, thus boosting the mean IQ.
Supposedly, education for blacks in the South was awful prior to the civil rights movement. If education makes any difference, perhaps IQ scores of southern blacks have gradually improved since the 1960s. The graph below shows mean IQ per decade for southern (blue line) and northern (red line) blacks (N = 4,435):

Notice, too, how the means increased for both groups, especially for southerners, over this period. Perhaps southern schools have gotten better, and some other factor has boosted scores for blacks in both regions. It could be some biological factor like nutrition, or perhaps something like more exposure to mainstream vocabulary words via television. I'm pretty sure the same 10 questions have been used since the beginning, so the quiz hasn't gotten easier.
Here is the graph for whites (N = 24,363):

It looks like northern blacks and especially southerners of both races benefited from something.
UPDATE: The South has gotten to be a more attractive region post-civil rights era. Perhaps part of the story is intelligent black and white northerners moving south, thus boosting the mean IQ.
Wednesday, December 19, 2018
A comment on criminal justice reform legislation
Folks should know some basic facts about criminals before applauding the Senate's vote for sweeping federal criminal justice reform.
One basic finding in criminology is that criminals are not specialists. They are opportunists who like to cut corners by stealing stuff, selling drugs, and using violence to get their way. Serving a sentence for drug dealing in no way implies that the offender is simply a businessman who never steals or attacks people. He happens to be serving a sentence for a drug conviction, but next time it is almost as likely to be for a property crime or violence.
Also--criminals who are serving time in federal prison for a drug offense are not decent people who simply have a drug addiction problem. They are traffickers. More than 90% of all felonies are plea bargained, so it is not uncommon for someone charged with trafficking to get it reduced to a lesser offense like possession in exchange for a guilty plea. The only druggies who are locked up in federal prison are people who commit other types of federal crimes--i.e., serious stuff.
Almost all ex-convicts recidivate. A recent study that tracked former inmates for 10 years found that more than 80% were reconvicted and returned to prison, many within two or three years. And those were only the criminals who were caught. Research shows that many offenders will commit dozens of crimes without ever being apprehended, and some criminals are more skilled at evading arrest and conviction than others.
All the evidence points to criminality being a life-long trait that is highly influenced by genes. Noticeably bad behavior emerges early in life, it becomes more obnoxious and dangerous when the boy (it's typically a boy) reaches adolescence; serious criminality peaks around age 20; and the criminal impulse weakens as a man ages into his 30s and beyond. It follows testosterone levels over the life-course. (There is another pattern of rebellious adolescence which starts later, ends much earlier, and remains more superficial than what we see with the hard cases.)
And one of the only ways to stop the biologically-driven career criminal is to incapacitate him behind bars.
And perhaps even dumber than setting hard cases free is to allow them conjugal visits, so we increase the rate of hard cases into the next generation.
One basic finding in criminology is that criminals are not specialists. They are opportunists who like to cut corners by stealing stuff, selling drugs, and using violence to get their way. Serving a sentence for drug dealing in no way implies that the offender is simply a businessman who never steals or attacks people. He happens to be serving a sentence for a drug conviction, but next time it is almost as likely to be for a property crime or violence.
Also--criminals who are serving time in federal prison for a drug offense are not decent people who simply have a drug addiction problem. They are traffickers. More than 90% of all felonies are plea bargained, so it is not uncommon for someone charged with trafficking to get it reduced to a lesser offense like possession in exchange for a guilty plea. The only druggies who are locked up in federal prison are people who commit other types of federal crimes--i.e., serious stuff.
Almost all ex-convicts recidivate. A recent study that tracked former inmates for 10 years found that more than 80% were reconvicted and returned to prison, many within two or three years. And those were only the criminals who were caught. Research shows that many offenders will commit dozens of crimes without ever being apprehended, and some criminals are more skilled at evading arrest and conviction than others.
All the evidence points to criminality being a life-long trait that is highly influenced by genes. Noticeably bad behavior emerges early in life, it becomes more obnoxious and dangerous when the boy (it's typically a boy) reaches adolescence; serious criminality peaks around age 20; and the criminal impulse weakens as a man ages into his 30s and beyond. It follows testosterone levels over the life-course. (There is another pattern of rebellious adolescence which starts later, ends much earlier, and remains more superficial than what we see with the hard cases.)
And one of the only ways to stop the biologically-driven career criminal is to incapacitate him behind bars.
And perhaps even dumber than setting hard cases free is to allow them conjugal visits, so we increase the rate of hard cases into the next generation.
Monday, December 17, 2018
Data: Cleanliness is next to godliness, or the irreligious are slobs
In the last post, I accidentally discovered that people with no religion have the dirtiest homes of all religious statuses. Let's look at this a little more. Below you will see mean dirtiness scores by church attendance. I'll limit the analysis to whites -- blacks show no trend:
Mean dirtiness score
Never attends 2.11
< one per year 2.04
Once per year 1.87
Several times per year 1.85
Once a month 1.91
2-3 times a month 1.85
Nearly every week 1.77
Every week 1.64
More than weekly 1.72
You can see here a tendency for more religious people to keep a cleaner home. This is consistent with my earlier point that religious individuals tend to be more conscientious or self-disciplined. Lazy people, even if they believers, may want to stay in bed on a cold Sunday morning. Keep in mind that the gaps are not big here: If we focus on the largest difference, never attenders vs. weeklies, the gap is close to one-half of a standard deviation -- a moderate difference.
UPDATE: I just a quick look at dirtiness scores by political orientation. The pattern is very similar to that for religiosity: extremely conservative people are about half a standard deviation cleaner than extreme liberals.
Mean dirtiness score
Never attends 2.11
< one per year 2.04
Once per year 1.87
Several times per year 1.85
Once a month 1.91
2-3 times a month 1.85
Nearly every week 1.77
Every week 1.64
More than weekly 1.72
You can see here a tendency for more religious people to keep a cleaner home. This is consistent with my earlier point that religious individuals tend to be more conscientious or self-disciplined. Lazy people, even if they believers, may want to stay in bed on a cold Sunday morning. Keep in mind that the gaps are not big here: If we focus on the largest difference, never attenders vs. weeklies, the gap is close to one-half of a standard deviation -- a moderate difference.
UPDATE: I just a quick look at dirtiness scores by political orientation. The pattern is very similar to that for religiosity: extremely conservative people are about half a standard deviation cleaner than extreme liberals.
Saturday, December 15, 2018
Data: Do immigrants make America dirtier?
Pacific Life pulled its ads from Fox News after Tucker Carlson said immigrants make America dirtier. In my experience, black and Hispanic communities tend to be dirtier than white neighborhoods (although I lived in a clean middle-class, predominantly black neighborhood), but is this the case for immigrants?
I don't have data for neighborhoods, but General Social Survey interviewers rated people's homes during interviews. Ratings ranged from very clean (1) to dirty (5). The mean for people born in the country is 1.93; for immigrants, it's 1.86. So immigrants' homes are slightly cleaner.
Tucker might have had a white/immigrant comparison in mind. The white mean is 1.88 -- a number similar to immigrants.
Let's look at a dirtiness ranking among selected ethnic groups in the US:
Mean household dirtiness (N = 3,657)
Black 2.17
American Indian 2.17
Mexican 2.04
Irish 1.91
Swedish 1.91
Chinese 1.90
Filipino 1.90
India 1.90
German 1.87
Polish 1.85
English/Welsh 1.85
Puerto Rican 1.82
Italian 1.73
Russian 1.71
Greek 1.65
Blacks, American Indians, and to a lesser extent, Mexican Americans have the highest dirtiness ratings which is consistent with my experience of neighborhoods. Greeks are the cleanest. It seems to me that cleanliness is a measure of conscientiousness. Jews seem conscientious, so let's look at religion, too, and see if the numbers match my thinking.
Buddhist 2.13
None 2.10
Protestant 1.91
Catholic 1.84
Hindu 1.84
Muslim 1.76
Jews 1.68
Jews come in the cleanest. Buddhists and people with no religion are the dirtiest. Religious people do tend to be more conscientious. Keep in mind the differences are not large. The gap between Greeks and blacks/American Indians is only one-half of a standard deviation.
It's possible that people differ somewhat in terms of indoor and outdoor behavior. I'm messy in my house but freak out if I drop a gum wrapper in a public place.
I don't have data for neighborhoods, but General Social Survey interviewers rated people's homes during interviews. Ratings ranged from very clean (1) to dirty (5). The mean for people born in the country is 1.93; for immigrants, it's 1.86. So immigrants' homes are slightly cleaner.
Tucker might have had a white/immigrant comparison in mind. The white mean is 1.88 -- a number similar to immigrants.
Let's look at a dirtiness ranking among selected ethnic groups in the US:
Mean household dirtiness (N = 3,657)
Black 2.17
American Indian 2.17
Mexican 2.04
Irish 1.91
Swedish 1.91
Chinese 1.90
Filipino 1.90
India 1.90
German 1.87
Polish 1.85
English/Welsh 1.85
Puerto Rican 1.82
Italian 1.73
Russian 1.71
Greek 1.65
Blacks, American Indians, and to a lesser extent, Mexican Americans have the highest dirtiness ratings which is consistent with my experience of neighborhoods. Greeks are the cleanest. It seems to me that cleanliness is a measure of conscientiousness. Jews seem conscientious, so let's look at religion, too, and see if the numbers match my thinking.
Buddhist 2.13
None 2.10
Protestant 1.91
Catholic 1.84
Hindu 1.84
Muslim 1.76
Jews 1.68
Jews come in the cleanest. Buddhists and people with no religion are the dirtiest. Religious people do tend to be more conscientious. Keep in mind the differences are not large. The gap between Greeks and blacks/American Indians is only one-half of a standard deviation.
It's possible that people differ somewhat in terms of indoor and outdoor behavior. I'm messy in my house but freak out if I drop a gum wrapper in a public place.
Thursday, December 13, 2018
Data: Among East Asians, are lighter-skinned people smarter than darker ones?
Three times in a row (for Hispanics, whites, and Asian Indians), I've shown that the lighter skinned members of a group tend to be smarter than darker members.
I now find the same pattern for a small sample of East Asians born in the US (n = 24). The correlation between darkness and IQ (based on a vocabulary test) is -.16 -- a small effect.
Note: A potential confound occurs to me. Do lower IQ people spend more time in the sun? With larger samples, it might make sense to look at the sexes specifically. Lower IQ men might work outside more, but I wouldn't expect this for low IQ women.
I now find the same pattern for a small sample of East Asians born in the US (n = 24). The correlation between darkness and IQ (based on a vocabulary test) is -.16 -- a small effect.
Note: A potential confound occurs to me. Do lower IQ people spend more time in the sun? With larger samples, it might make sense to look at the sexes specifically. Lower IQ men might work outside more, but I wouldn't expect this for low IQ women.
Tuesday, December 11, 2018
Data: Are lighter-skinned Asian Indians smarter than their darker counterparts?
As I've done in the last couple posts, I correlated the skin tone of General Social Survey participants with IQ scores -- this time for people whose ancestors are from India.
The sample is small, only 39, but the correlation is impressive: -.40. In plain English, the tendency for lighter Indians to be smarter is fairly strong.
This is the third group in a row (Hispanics, whites, now Indians) that has showed the same positive lightness/IQ correlation.
The sample is small, only 39, but the correlation is impressive: -.40. In plain English, the tendency for lighter Indians to be smarter is fairly strong.
This is the third group in a row (Hispanics, whites, now Indians) that has showed the same positive lightness/IQ correlation.
Monday, December 10, 2018
Data: Are pasty whites smarter than olive-skinned whites?

This study shows some evidence for what some contend; that northern Europeans tend to be more intelligent than Mediterranean people. In a recent analysis of General Social Survey data, I found little evidence that IQ varies among whites by which European country your ancestors come from.
As an alternative approach, let's see if there is a correlation between skin tone, as rated by interviewers, and IQ among self-identified whites. Keep in mind IQ is measured with a vocabulary test.
It turns out the the correlation for a sample of 3,162 whites is -.13, meaning there is a slight tendency for pasty whites to be smarter than olive-skinned whites.
Don't accuse me of bias: While my ancestry is 100% northern European, people always ask me if I'm Italian or something. My maternal grandfather was a dead ringer for Vincent Gardenia ("You've got three kinds of pipe").
Friday, December 07, 2018
Data: Are lighter-skinned Hispanics smarter than those with a darker tone?
The General Social Survey (GSS) had interviewers rate the skin tone of respondents from 1 (lightest) to 10 (darkest). This can serve as a rough proxy of European ancestry. GSS also gave them a ten-question vocabulary quiz which is highly correlated with verbal IQ. I limited the analysis to Hispanics born in this country who self-identified as white (N= 185).
The correlation between IQ and skin tone is -.28, which indicates a medium-strength association between European ancestry and higher intelligence.
The correlation between IQ and skin tone is -.28, which indicates a medium-strength association between European ancestry and higher intelligence.
Data: Both men and women are happiest if they have one sexual partner
The last post showed that men with a minimum of one sexual partner in the past year are happier than men with nobody. But does a man gain more happiness as the partners increase beyond one? Here's a graph showing mean happiness by partner number:


We see that mean happiness drops back down to the celibate level beyond one partner with the exception of the very small number of guys saying they had more than 100 partners.
What about women?

As with men, the happiest women had one partner last year. Celibates are less happy as are those with more partners. The mean happiness for the very small number of women with more than 100 partners is very low.
Thursday, December 06, 2018
Data: Are men who have a sexual partner happier?

Writing about sexual inequality among males got me wondering about the bottom line: Are men who have no partners unhappy?
As we discussed before, the General Social Survey asked people how many sexual partners they had in the past year. They also asked if the person was generally very happy, pretty happy, or not too happy these days.
The graph shows that men with at least one partner tend to be happier. Specifically, 32% with at least one partner is very happy, compared to only 23% of those with no one.
On the other extreme, 19% of the celibate guys were not too happy, while the number for the other group was only 11%.
So having a sex partner is associated with happiness. We just don't know what's causing what. I like to think that sex is not as important as elite culture assures us it is, but it could be the driving force here.
On the other hand, unhappy people might have less luck finding and holding on to partners. I suspect more and more that personality traits, which are grounded in brain wiring and are due to a large extent to genes, explain a lot. It might be, for example, that people who score high on negative emotionality are more likely to find themselves alone.
Wednesday, December 05, 2018
Data shocker: Higher status men tend to have more attractive wives
After blogging recently on sexual inequality among men, I'm surprised that it's so easy for people to be so skeptical about basic ideas that come from evolutionary theory. I would never question that some men have more sex than others. It's obvious. I don't naturally waste limited mental energy on this type of issue until someone comes along and questions it.
So, it made me wonder: How many people doubt that high status men tend to have better looking wives? Here's a graph from GSS based on 587 women whose physical attractiveness was rated by interviewers (1-5) and who were asked the educational level of their spouses:

The x-axis is years of school completed by the husband, and the y-axis is the mean of the wives' attractiveness.
You can see that attractiveness tends to rise with the husband's education. To get specific, high school dropouts have wives that are roughly three-fifths of a standard deviation less attractive than the most educated group.
I don't know about you, but I'm shocked.
UPDATE: I'm overeducated and have a smokin' hot wife, so I'm biased.
ANOTHER UPDATE: I suspect the status-hotness relationship would be even stronger if men rated the women. Most GSS interviewers are women, and I strongly suspect they tend to be biased toward rating a woman's face, dress, cosmetics, etc., while men tend to focus on curves.
So, it made me wonder: How many people doubt that high status men tend to have better looking wives? Here's a graph from GSS based on 587 women whose physical attractiveness was rated by interviewers (1-5) and who were asked the educational level of their spouses:

The x-axis is years of school completed by the husband, and the y-axis is the mean of the wives' attractiveness.
You can see that attractiveness tends to rise with the husband's education. To get specific, high school dropouts have wives that are roughly three-fifths of a standard deviation less attractive than the most educated group.
I don't know about you, but I'm shocked.
UPDATE: I'm overeducated and have a smokin' hot wife, so I'm biased.
ANOTHER UPDATE: I suspect the status-hotness relationship would be even stronger if men rated the women. Most GSS interviewers are women, and I strongly suspect they tend to be biased toward rating a woman's face, dress, cosmetics, etc., while men tend to focus on curves.
Data: Hirono is a moron -- Republican mean IQ is 2 points higher than mean Dem IQ
In this video, Senator Hirono explains that Democrats have a difficult time connecting to voters because, like the worst math teacher you ever had, they are simply too smart.
Ms. Hirono with her enormous brain should be able to understand this: According to the General Social Survey (GSS) data, those of us who vote Republican have higher average IQs than those pull the lever for Democrats.
The most recent data we have is for 2012. GSS participants are given a 10-question vocabulary quiz, which is a serviceable measure of IQ. I converted the vocab scores to IQ scores, setting the mean at the US average -- 98 (Did I just hear the fish from SpongeBob say, "WAH, Wah, wah"?). More than 2,000 people were also asked about their 2012 vote.
The results? The mean IQ score for those who voted for Obama was 97.0. For Romney, it was 99.1. Not even close.
UPDATE: Even more depressing news: The actual mean IQ in the US is more like 97 than 98, so we can adjust the Dem mean down to 96.0, and the GOP mean down to 98.1. And if current immigration trends continue, we can all look forward to those numbers continuing to drop over the next few decades.
Tuesday, December 04, 2018
Intelligent Christianity creates the foundation for science, while the universities are trying to destroy it
I knew reading America's greatest philosopher, Charles Peirce, would pay off. He has taught me the root of our current predicament.
You're baffled that supposedly intelligent people now claim there are 56 genders? Peirce informs us that the villain is William of Ockham. You say you're shocked? Isn't Ockham that awesome dude who said that the simpler is more likely to be true? Well, let me educate you. Ockham is an ass.
Plato got it wrong when he claimed that the redness we see in an apple is actually a property that exists in the World of Forms, and is only imperfectly instantiated in a particular apple. In other words, redness truly exists independently of any particular red things.
Then the greatest philosopher in the history of the world, Aristotle, said, "Master Plato, you're off your rocker." He explained that redness is a real thing but it only exists in particular objects.
Later, the Catholic Church fervently embraced Aristotle. Ockham was a devout Catholic, but he got some bad ideas from Muslim fools about God's omnipotence, and ended up concluding that what we call redness is just something humans impose on objects. To Ockham, there are just unique, particular things, and we invent classes and categories. Do you hear a whisper here? I can make it out: "Social construction..."
The amazing thing is that modern philosophers took Ockham and ran with it at the same time that modern science was progressing by leaps and bounds based on the old fashioned belief that there are such things as natural classifications. Not just hydrogen and helium, but male and female.
Ockham's view is called "nominalism." Aristotle's is called "realism." Modern philosophers are generally nominalists, while scientists operate like realists, whether they know it or not.
Until now. Now we see social scientists take Ockham seriously, and it's no surprise that categories that were taken for granted for centuries are now under assault. Nominalists are ANTI-science. They tend to reduce all understanding to dust.
But you science lovers say,"We'll at least they aren't TRUE anti-science people like those evil Catholics." The truth is that in the Roman Catholic church, it is a damn HERESY to be a nominalist. I'm not kidding.
Intelligent Christianity creates the foundation for science, while the universities are trying to destroy it.
You're baffled that supposedly intelligent people now claim there are 56 genders? Peirce informs us that the villain is William of Ockham. You say you're shocked? Isn't Ockham that awesome dude who said that the simpler is more likely to be true? Well, let me educate you. Ockham is an ass.
Plato got it wrong when he claimed that the redness we see in an apple is actually a property that exists in the World of Forms, and is only imperfectly instantiated in a particular apple. In other words, redness truly exists independently of any particular red things.
Then the greatest philosopher in the history of the world, Aristotle, said, "Master Plato, you're off your rocker." He explained that redness is a real thing but it only exists in particular objects.
Later, the Catholic Church fervently embraced Aristotle. Ockham was a devout Catholic, but he got some bad ideas from Muslim fools about God's omnipotence, and ended up concluding that what we call redness is just something humans impose on objects. To Ockham, there are just unique, particular things, and we invent classes and categories. Do you hear a whisper here? I can make it out: "Social construction..."
The amazing thing is that modern philosophers took Ockham and ran with it at the same time that modern science was progressing by leaps and bounds based on the old fashioned belief that there are such things as natural classifications. Not just hydrogen and helium, but male and female.
Ockham's view is called "nominalism." Aristotle's is called "realism." Modern philosophers are generally nominalists, while scientists operate like realists, whether they know it or not.
Until now. Now we see social scientists take Ockham seriously, and it's no surprise that categories that were taken for granted for centuries are now under assault. Nominalists are ANTI-science. They tend to reduce all understanding to dust.
But you science lovers say,"We'll at least they aren't TRUE anti-science people like those evil Catholics." The truth is that in the Roman Catholic church, it is a damn HERESY to be a nominalist. I'm not kidding.
Intelligent Christianity creates the foundation for science, while the universities are trying to destroy it.
Monday, December 03, 2018
I pray Google Ads doesn't understand our readers
The last post mentioned machine learning. Look at a current Inductivist ad link below: PLEASE don't tell me that some machine is figuring out the tastes of our readers.
Current Inductivist ad
Current Inductivist ad
Study reveals an evil secret: You can look at a brain and tell whether it is a man or woman
In this new study, the researchers use MRIs to measure examines the brains of a fairly large sample (N = 1,300) of incarcerated men and women. They use machine learning to classify sex. They are able to predict whether the brain is of a male or a female with 93% accuracy. This finding replicated what the authors found earlier with a healthy, non-incarcerated sample.
Now, how are these findings possible when every good person knows men and women have interchangeable brains, and to think otherwise makes you a Neanderthal?
The researchers also found that there were certain brain regions that are highly differentiated: the orbitofrontal and frontopolar regions, larger in females, and the anterior medial temporal regions, which are larger in males. Reduced functioning in the orbitofrontal region has been linked to aggression and violence. The anterior temporal cortex is closely connected to limbic and paralimbic structures that influence social and emotional processing, traits associated with disinhibition and violent/aggressive behavior.
The frontopolar and orbitofrontal regions are also crucial in moral judgment and planning behavior. The temporoparietal junction is also important for execution of attentional shifts required for perspective-taking, theory of mind, and empathy.
This is also consistent with the behavioral deficits males show with respect to interpersonal skills, empathy, threat sensitivity, disinhibition, and aggression.
Conclusion: Grandma was right--men and women are (biologically) different.
Subscribe to:
Posts (Atom)
Are gun owners mentally ill?
Some anti-gun people think owning a gun is a sign of some kind of mental abnormality. According to General Social Survey data, gun owners ...

-
 In the comments in the last post , some readers contended that Jews are not ethnocentric. Using the same question I used in the comments se...
 -
Via a reader at iSteve, it looks like this might be the vocabulary test used by the General Social Survey. (Someone please tell me if I'...
-
I've been distributing a questionnaire to students which, among other things, asks them their religion. Quite a few have answered "...