Saturday, February 17, 2007

Are cell phones the reason for the 90s crime decline?


Steve Sailer has suggested that the spread of cell phones in the 1990s helps explain the concurrent drop in crime since youths contemplating a life of crime might think twice if witnesses can easily call the police during the commission of a crime. I found this graph which shows steady growth in phone ownership in America during the 1990s, especially after 1992. Robbery, for example, peaked in 1991 and dropped until around 2000, so there is a rough correspondence here. Plus, my impression is that young people--those most likely to be victims and, presumably, witnesses of crime--were the first to jump on the mobile phone craze.
Roughly half of Americans now have a mobile phone, so one could argue that if their availability were important we should have seen a drop that continued until the present day, instead of the observed plateau. But it might be that beyond, say, a 20-25% cell phone prevalence rate, additional phones would not make much difference. Only 4 random people would need to witness a crime for one to have a phone handy. Such a risk might be too high.
Smart people are only slightly less criminal: Plato thought that if people broke the law, they did it out of lack of understanding, since men naturally and rationally pursue happiness, and crime only brings misery. He would have predicted a strong inverse correlation between IQ and criminality, but the General Social Survey disagrees with him. I used logistic regression to estimate the relationship between a person's score on a vocabulary test and whether they have ever been arrested (1 for yes, 2 for no). The coefficient for whites is .052, and it's .054 for blacks. In English, what that means is that IQ explains not even close to one percent of criminality. Maybe Plato wanted to see a virtue in people like himself that just isn't there.

Thursday, February 15, 2007

Looking again at southern intelligence: I was watching a 1993 video about juveniles and the death penalty and said to myself, "All these deathrow teens are dumb white Southerners," and it got me curious again about the idea that whites from that part of the country ain't so bright. When I looked at educational levels in an earlier post, the Southeast was low, but the West South Central Division (Arkansas, Oklahoma, Louisiana, Texas) was not. The General Social Survey (GSS) showed us previously that education and IQ are only moderately correlated, so let's look at the GSS's measure of intelligence--the number of vocabulary words out of 10 answered correctly. I list the divisional means from highest to lowest for whites only:


Mean vocabulary score

New England 6.65
Pacific 6.53
Middle Atlantic 6.52
Mountain 6.48
West North Central 6.33

USA 6.25

East North Central 6.14
South Atlantic 6.07
West South Central 6.00
East South Central 5.42

The stereotype is confirmed: the lowest three divisions are all southern. But the East North Central division (IL, IN, MI, OH, WI) is also below average. The Mountain states in someways feel like the South, but as we saw with data on Mormons, folks in that region are not dumb.

So what's the reason for low Southern averages, especially in Alabama, Mississippi, Tennessee, and Kentucky? A history of inbreeding? And folks from down there, don't get sensitive: we recognize that you have your Faulkners.

Sunday, February 11, 2007

Russell Crowe's sexual orientation revealed: With Hollywood overrun with pretty boys, it reassured me to know that at least we had Russell Crowe to remind us that men are skirt-chasin' jerks. Now I read that he will no longer have cheerleaders for his rugby team, the South Sydney Rabbitohs, because his feminist wife doesn't like them. We always knew he was a good actor, but now we know he uses his talents to act straight.
Agnostics are the most intelligent: If you ask me to say the first thing that pops into my head when I am asked about who's the smartest in terms of believing in God, I would answer atheists. But it turns out that I'm wrong. According to the General Social Survey, agnostics are the smartest:


Mean vocabulary score


Whites

Doesn't believe 6.52
No way to find out 7.24
Some higher power 6.96
Believes sometimes 6.02
Believes but doubts 6.42
Knows God exists 6.05


Blacks

Doesn't believe 4.60
No way to find out 4.36
Some higher power 5.65
Believes sometimes 4.47
Believes but doubts 4.98
Knows God exists 4.90

I'm focusing on the white numbers when I draw my conclusions since sample sizes are small for blacks. Atheists don't even come in second: "some higher power" does. Those who know God exists are by far the largest group, but the numbers here tell us that uncertainty (or vagueness, as in "some higher power") increases with IQ. (I, myself, don't believe on Tuesdays, Thursdays, and Saturdays).

Wednesday, February 07, 2007

The answer to the male shortage on campus: I seem to be the only person here (at the university) who is concerned about the shortage of male students. Two-thirds of our criminal justice majors are women? Huh? But then it dawned on me how to get more guys in the seats. We need to hire smokin' hot women professors. It's guaranteed to work. No one has ever asked "Where are the male customers?" at Hooters. And if the instructors dress fashionably, it will keep the female students interested too. Genius, but why does nobody ever listen to me?!

Tuesday, February 06, 2007

China profiled: I'm interested in constructing "personality profiles" of countries around the world, and I chose China as my first project since it is the biggest. I looked at more than 300 questions asked of citizens by the World Values Survey and listed below any where China ranked in the top or bottom 5 (of more than 40 countries). In this manner, we can see in which ways a country is distinctive. Questions covered many topical areas including domestic and international politics, economics, family, religion, lifestyle, and culture.


In the top 5

politics are important
couples should share political values
belongs to political party
government ownership should be increased
confident in armed forces, education, legal system, parliament, and social security

enough wealth can grow for everyone
important to have a strong economy and to maintain order
there should be more focus on technology

willing to fight for country
people can be trusted (probably have Chinese in mind)
have confidence in the military, education, legal system, parliament, social security

job is most important thing in life
more efficient should get more pay
materialism index

percent married
ideal family, 2 or fewer kids
kids need both mom and dad
being a housewife is just as fulfilling
important that kids learn thrift and determination
abortion acceptable for single mom, or if a women wants no more kids, or for a defect


In the bottom 5

to have successful marriage, couples should: share same religion, have good housing, live away from in-laws, have good sex life, and children
kids are hurt if mom works
approves of single moms
children should be taught religious faith, good manners, and obedience

important for work: pleasant people, generous holidays, meeting people, feel achievement, responsibility, interesting work
has a great deal of decision-making freedom
people are poor because they are lazy
competition is harmful
society should de-emphasize the importance of work

families, friends, leisure time, and religion are important
belong to a religious org, do volunteer work for one
belongs to a church
believes in a personal God
prays often
God is important in life
shares parents religious beliefs
has confidence in churches

people should have more say in government
country is run by a few big interests
confident about European community, NATO
trusts neighboring countries
trusts superpowers
wants Muslims for neighbors
society needs to: be more humane, focus on individual development, and focus more on family
approves of human rights movement
identifies first as world citizen
new ideas are usually best

thinks often about death
feels lonely or upset


Let's attempt some generalizations. China places great importance on politics and has faith in the powers that be. The Chinese are patriotic and suspicious of others. A humanitarian ethic is less developed. Work is also central, and people value merit, thrift, competition and determination (sounds like capitalists, no?). China is one of the least religious countries in the world. They value traditional family forms, but think it is good for women to work, and approve of abortion and small families. The people seem sober, practical, materialistic, and moderately contented. (Keep in mind that respondents might at times give answers they think are government-approved.)

Sunday, February 04, 2007

The secular creep: Using the General Social Survey, I averaged the percent of Americans who never attend church:


Percent never going to church

Whites
70s: 14.0
80s: 14.8
90s: 17.3
00s: 20.4

Blacks
70s: 6.8
80s: 8.3
90s: 8.9
00s: 10.7

So the increase in church avoidance is up 46% for whites and 57% for blacks over (roughly) 3 decades. One in five whites never attends religious services. America is still one of the most religious countries in the world (with indicators similar to Ireland, Poland, and India) but the drift is in a European direction. I suspect that the trend has less to do with growing disbelief than with diminishing appeal and sense of obligation, and later I'll see what the data say.

Saturday, February 03, 2007

More evidence that white NFL players are discriminated against: In the fall of 2005, I did an analysis of NFL stats to assist Steve Sailer who wrote a piece for VDARE about possible discrimination against white players. Using data from Caste Football on the number of white starters and nonstarters, I found that over a three-year period, teams with more white benchwarmers were noticeably more likely to win games. The number of white starters didn't matter much, but each additional 2.2 to 5 white nonstarters (depending on the year) resulted in an extra win. Caste Football’s J.D. Cash has suggested that perhaps white utility players are more likely to master the playbooks for multiple positions, and Steve added that perhaps benching black athletes who often have large egos poisons the atmosphere and lowers team spirit.

In the scientific spirit of replication (and the fact that tomorrow is the Super Bowl) I ran the numbers again for the year that is now coming to an end. Looking at the regular season, we see the same pattern observed in previous years: the percent of white starters does not seem to matter (r=.06) but the correlation between nonstarters and wins is noteworthy: .20. An example based on estimating a regression model will make more intuitive sense: if Jacksonville, who had only 5 white non-starters, were like the Jets who had 15, they would have won an estimated 2 additional games. This may not sound like all that much, but as Sailer wrote, in a game of many complex factors, identifying a factor that might turn an average team into a playoff contending team is a big deal.

Thursday, February 01, 2007

Women and job prestige: I'm interested in two questions: which ethnic group has the most prestigious women, and how do they compare to their male counterparts? Using General Social Survey data on Americans of various ethnicities, I first list the mean occupational prestige and then the gap with males:


Mean prestige score for females (female - male in parentheses)

Chinese 51.68 (+1.15)
Jewish 48.89 (-3.94)
Russians 48.01 (-1.26)
Scots 47.37 (+.77)
Indians 47.23 (-10.60)
Danes 46.91 (-.73)
Swedes 46.13 (+.49)
English/Welsh 45.74 (-.89)
Norwegians 45.16 (-.53)
Filipinos 45.04 (+3.93)
Italians 44.61 (-.70)
Czechs 44.55 (-.76)
French 44.51 (+1.27)
Irish 44.10 (-1.09)
Poles 44.09 (-2.66)

All women 43.66 (-.48)

Germans 43.54 (-.58)
Spaniards 43.20 (-1.47)
Puerto Ricans 41.71 (+3.06)
Blacks 41.16 (+2.46)
French Canadians 40.80 (-1.67)
American Indians 40.80 (+.97)
Dutch 40.76 (-.86)
Mexicans 38.62 (-1.18)

Chinese women have the most prestigious jobs by far, and they even exceed Chinese men by 1.15 points. They and Indians are two non-white groups in the top five. The Russian number is elevated some since many Jews are from Russia. Northern and Eastern Europeans have the highest numbers for gentile whites. Four groups--two of them white--are lower than black women.

Women in eight of the 22 groups exceed the men, and males are only ahead a little bit in the overall numbers. The female advantage is large for Filipinos, Puerto Ricans, and blacks.

So, these numbers tells us that prestigious jobs in America are in no way reserved for men--in many cases, women have higher status positions. Nor do non-white women find that they cannot ascend to the highest ranks. Not only do Chinese women surpass all other women, but also the vast majority of men.
More evidence on Sun versus Ice People: In an earlier post, I reported that, according to World Values Survey data, northern Europeans are the happiest, eastern Europeans are the gloomiest, and sub-Saharan Africans are in the middle. This finding runs contrary to the view that blacks are "Sun People" while whites are "Ice People." Some might argue that much of the observed pattern is due to the social conditions of these regions (although conditions are better in E. Europe than SS Africa) but what do we see if we look at ethnic groups who are living in the same general environment (i.e., country)?

The General Social Survey has asked 33,867 Americans how happy have they felt lately. Answers ranged from very happy (1) through pretty happy(2) to not too happy (3). I calculated means for all the ethnic groups and subtracted them from 3 so that higher numbers indicate happier people:


Mean happiness score

Greeks 1.34
Danes 1.30
Belgians 1.29
French Canadians 1.29
Romanians 1.29
English/Welsh 1.28
Swedes 1.27
Scots 1.26
Norwegians 1.25
Dutch 1.25
Irish 1.24
Germans 1.24
France 1.24
Finns 1.23
Filipinos 1.21

USA 1.20

Poles 1.20
Czechs 1.20
Yugoslavs 1.19
Italians 1.19
Japanese 1.18
Hungarians 1.18
Jews 1.17
Indians 1.16
Austrians 1.16
Russians 1.16
American Indians 1.16
Mexicans 1.15
Spaniards 1.15
Chinese 1.13
Lithuanians 1.12
Blacks 1.02
Arabs 1.02
Puerto Ricans 1.00
West Indians .89

The American pattern does not square at all with the Sun/Ice dichotomy: blacks, especially West Indians, are at the bottom of the list, while N. Europeans fall toward the top. And E. Europeans are below average among Americans, as they are when comparing countries. More broadly, whites are happier than non-whites: the only above-average group of color is Filipinos.

I'd be surprised if some racism hunter has not discovered this pattern so he can demonstrate yet another way that the Man keeps the browns down. I am reminded of a Puerto Rican graduate student friend of mine who was conducting research to show that assimilating people of color causes them to become mentally ill.

Friday, January 26, 2007

Young black and Hispanic kids are the most hyperactive and antisocial: A reader suggested in an earlier post that the black orientation toward authority is the product of living among many lawless young people. It seems likely that culture is often a reaction to the characteristics of the group. The college-prep class can afford to have a less structured environment that fosters self-direction than a classroom at a last chance school.

But do blacks, on average, behave any differently than whites? A surprisingly candid study I found in the Journal of Marriage and Family (2003; 65:835-849) analyzed data on more than 2,000 black, white, and Hispanic kids (the National Longitudinal Survey of Youth). They looked at kids from age 5 to 13 and found that blacks had the highest rates of hyperactivity, Hispanics second, and whites third. The gap was evident at age 5 and it persisted through age 13. They began measuring antisocial behavior at age 7: the racial/ethnic ranking was the same, but while blacks and Hispanics got increasingly antisocial as they aged, whites did not. I suspect this pattern is common: early (possibly genetic) differences being magnified by different environments.

Now the author attibuted hyperactivity to home environment variables (he is a sociologist, after all), but I've seen several studies reporting large heritability. So, if a community has a greater density of hyperactive children and antisocial youths, one would expect it to react with a more authoritarian culture.

But as we have seen on this blog, values and behavior are not always consistent: in spite of all their bluster about kids needing a good whoopin' once in a while, the study shows that blacks do not spank their kids more often than whites. And incidentally, whites provide more emotional support and cognitive stimulation.

Wednesday, January 24, 2007

Blacks are more authority-oriented than other groups: People in more than 40 countries were asked what qualities children should be encouraged to learn at home (World Values Survey). While looking at the numbers I noticed that the two African countries--Nigeria and South Africa--are at the top of the list for obedience, good manners, and religious faith, and are at the bottom for imagination. They also rank number 1 and 2 on the question of whether greater respect for authority would be a good thing. Looking at the General Social Survey, American blacks are also much more likely than whites to feel that learning obedience to parents and good manners is desirable (43% vs. 30% and 46% vs. 23%).

Even though these people live in very different societies, a pattern emerges here of blacks being more oriented toward submission and authority than others. Such an orientation might make it more difficult to know how to act in situations of low social control or with the absence of a hierarchy.
Even more on religion and crime: A reader suggested that people who have no religion and actively reject religion will be less criminal than people who have a church. (Given that I showed earlier that affiliated people are less criminal in general, the reader implies that the group with the truly high rates of illegality will be those with no church who nevertheless accept religion). The closest I could find on the GSS to a rejection of religion was a question about thinking religion is unimportant. The results look like this:


Percent of whites with no religion ever arrested

Those saying religion is unimportant 30.8 (N=65)
Those saying it is important 44.4 (N=18)

We can't have too much confidence with the small samples, but it looks like those who question religion's importance are less criminal. They are, however, still arrested at a rate much higher than the largest white religious group, Protestants (9.0%). (I analyzed whites since they are the only group large enough. There was only one year where questions were asked about both arrest and importance of religion. By the way, the numbers above are higher than for arrests for all years combined).

I suspected that high-IQ, non-religious people might have low crime rates since they have resources apart from religion to keep them law-abiding. Their numbers:


Percent of whites with no religion ever arrested

High IQ (wordsum 8-10) 21.1
Medium IQ (wordsum 5-7) 25.7
Low IQ (wordsum 1-4) 27.7

There is a little support for my idea here, but not much. Even the high IQ group is substantially more criminal than the 9% for white Protestants I mentioned above.

Tuesday, January 23, 2007

The greater male interest in politics is universal: The World Values Survey asked people from 43 countries if they were interested in politics. Fifty-nine percent of men and 45 percent of women said they were, either a lot or somewhat. Alone, these numbers don't raise my eyebrows much, but as I look down the list of countries, I notice that the greater male interest is true in every country. (South Korea has greater female interest in the year examined, but I looked at the 3 other years that the question was asked and the male numbers were higher in each case). The country with the smallest gap is northern Ireland (37% v. 32%) but a small difference isn't a surprise since the general level of interest is very low. Japan is on the other extreme with 74% of men interested, compared to only 51% of women.

Men and women are not only different--they're different everywhere.

Friday, January 19, 2007

The Sunny Scand and the Morose Muscovite: Steve Sailer writes about how Dr. Lionel Jeffries might be onto something when he calls Africans "Sun People" and Europeans "Ice People": "[T]here seems to be some sort of correlation between gloomy, cold weather and gloomy, cold personalities, just like there is between sunny, warm weather and sunny, warm personalities."

When I read Jeffries, I thought he made a lot of sense, although it was clear he meant it as an insult to whites. But the World Values Survey gives us little reason to see northern Europeans as gloomy. I've got the book in front of me of the data from the early 90s, and the picture that emerges is of an optimistic, happy, and friendly people. Look how often northern European countries are in the top 5 (out of around 40 countries):

Percent ever feeling on top of the world in past few weeks (no pun intended)
1. Sweden 77
2. Turkey 73
3. Denmark 64
4. Iceland 63
5. Norway 59

Percent ever feeling depressed in past few weeks
38. Belgium 14
39. Slovenia 13
40. Sweden 10
41. Iceland 7
42. Switzerland 7

Percent ever feeling that things were going their way
1. Iceland 84
2. Turkey 76
3. Sweden 73
4. USA 72
5. Canada 70

Percent feeling satisfied with life as a whole
1. Denmark 86
2. Switzerland 86
3. Netherlands 85
4. Iceland 85
5. Canada 84

Percent saying they are very happy
1. Netherlands 48
2. Ireland 44
3. Denmark 43
4. USA 41
5. Iceland 41

Percent saying friends are very important
1. Sweden 69
2. Norway 68
3. Netherlands 63
4. Brazil 57
5. Turkey 55

Percent belonging to a sports/recreational group
1. Netherlands 43
2. Denmark 34
3. Norway 33
4. W. Germany 32
5. Sweden 32

I won't give you numbers here (since I've hit you over the head already) but trust me, it's the Eastern Europeans who are the Ice People. The two regions are polar opposites (no pun intended). The two predominantly black countries--Nigeria and South Africa (Brazil is very mixed)--never break the top 7, and they usually fall somewhere in the middle. And the General Social Survey shows that American whites are significantly happier than their black counterparts. So the picture given to us by surveys anyway is of the Sunny Scand and the Morose Muscovite.

It might be that the good mood felt by the northerners is quieter, not shown in such a demonstrative way as with blacks. I wish I had a more northern example, but I knew an old Dutch immigrant very well. Old men are often grumpy, but I never saw this guy when he wasn't happy, but it was so subtle, you might call it just calm.

But what about suicide rates? Aren't they high in the North? Actually, they're more toward the middle (Finland is higher). Once again, Eastern Europe towers over the rest. And we must keep in mind that suicide is very extreme, and outliers don't necessarily tell us where the mean is.
More on religion and crime: I suspected that the correlation between not having a religion and being arrested might be due to gender: men are both less religious and more criminal than women. But this is what I found:


Percent ever arrested:

White men
Protestant 15.9
Catholic 19.2
Jewish 9.7
No religion 32.5

White women
Protestant 3.6
Catholic 3.9
Jewish 3.1
No religion 11.8

Black men
Protestant 25.4
Catholic 37.3
No religion 43.5

Black women
Protestant 7.0
Catholic 8.2
No religion 6.5

Even controlling for gender, people with a religion tend to be less criminal. And according to these numbers, religion is more important than race: non-affiliated whites have higher arrest rates than Protestant blacks (both men and women). The numbers, however, do show that race matters. I combined Chinese, Japanese, and Filipino Americans to make a sufficiently large group, and only one out of 55 had ever been arrested: a Catholic Filipino. The 10 Asians with no religion had zero arrests. It's interesting how 82% of this sample of Asians report a religion: clearly Asian Americans are more religious than people in the old country.

By the way, I looked to see why black Catholics are so much more criminal than Protestants. You can see in the numbers above that the difference is concentrated among men. The only factor I could find is that Black Catholics are a significantly younger group: more of them grew up during the era of high crime. I suppose they are younger because as Steve Sailer wrote, more black kids are being sent to parochial schools, and some convert. Steve also thought (as did I) that they might be concentrated in New Orleans, a crime-ridden city. But the largest share of them (according to the GSS) live in the mid-Atlantic division--NJ, NY, and PA.

Thursday, January 18, 2007

Americans who claim a religion are less criminal: The General Social Survey asked more than 9,000 respondents if they had a religion and whether they have ever been arrested. Here are the percent ever having been arrested:

Percent ever arrested

Whites
Protestants 9.0
Catholics 10.5
Jews 5.1
No religion 25.0

Blacks
Protestants 13.9
Catholics 22.5
No religion 28.6

Mexicans
Protestants 16.0
Catholics 14.9
No religion 54.5

People with no religious affiliation are a lot more likely to have been arrested, especially Mexicans (caution: non-affiliated Mexican sample is small--11). It's interesting how black Catholics, unlike for other ethnic groups, are much worse than they're Protestant counterparts. Later, I'll try to find evidence to explain this.

Of course, a correlation between naming a denomination and obeying the law does not prove that religion has a salutary influence on behavior: it might be that morally inclined people both claim a church and avoid crime. The most we can say is that these numbers support the thesis that religion improves behavior.

Part of the "no religion" group is made up of intelligent, skeptical people who have qualities making them unlikely candidates for a career in crime. If we removed them, I imagine the arrest rates of the rest would be even higher.

Monday, January 15, 2007

Mexicans have the worst values in the world: The World Values Survey asked people in all regions of the world in the early 90s if the following are ever justified: falsely claiming government benefits; avoiding transportation fare; buying stolen goods; cheating on taxes; stealing a car for a joyride; keeping lost money; lying in one's interest; being unfaithful; and accepting bribes. I averaged the ranks for each of the 40 countries, and zeroed in on the worst five:


Worst values ranking:
1. Mexico
2. Finland
3. France
4. West Germany
5. Belgium

Czechoslovakia is (was) about as bad as Mexico, but they were not asked several of the questions so they were left out. The remaining four were not even as close to being as accepting of bad behavior as Mexicans were. I'm sure that some respondents were creative and thought up ways when these things could be justified, but bleh--I still think the questions capture moral zeal or the lack of it.

But the neocons instruct us that Mexican immigration revitalizes America's decaying values. They will help us get our family lives back together. The wisdom of these guys is indeed breathtaking.

Saturday, January 13, 2007

More than any other country, America believes you should obey your boss: The World Values Survey asked people from 40 countries if you should follow your boss' instructions even if you don't fully agree, or should you be convinced first. While the world average was 32% agreeing to comply, the U.S. was almost double that (62%). Evidently, hierarchy in the workplace is really respected here.

Wednesday, January 10, 2007

People think that Americans of English descent have done the most for the country: The General Social Survey asked close to 1,000 Americans how much different ethnic groups have positively contributed to our society. The lists of countries the interviewers chose to include (shown below) is strange and was designed, I'm sure, to study prejudice and not achievement. But here are the results anyway:

Percent of Americans who say the ethnic group has made the biggest positive contribution (own group's view in parentheses):

English 31.0 (50.0)
Jews 12.1 (26.5)
Blacks 9.5 (29.7)
Irish 9.0 (15.7)
Japanese 8.9
Italians 8.1 (14.0)
Mexicans 4.3 (4.5)
Muslims 3.0
Puerto Ricans 2.9
Vietnamese 2.8
Cubans 2.5

The poor Germans who are only the largest ethnic group and have been here forever don't even make the list. I honestly don't know where many of these people are getting their answers from: you might think people say their own group is the best, but most of the time this is not the case. The percent saying their own group has done the most is in parentheses, and while the numbers are a larger than what all Americans together think, they're not not that much bigger.

Tuesday, January 09, 2007

Controlling for height, Asian women are still the lightest by far: Continuing the topic of fatness, I thought a close look at how much women weigh would anger any feminists passing through, so I decided I had to do it. I looked at the National Health Interview Survey to calculate the mean weight of American women by ethnic group. Here's what I got:


Women's mean weight (without shoes):

Black 160.0
American Indian 150.3
White 143.4
Hispanic 143.1
Asian 122.3

Not surprisingly, the Black mean is a lot higher and the Asian mean a lot lower than the others, but this is an unfair comparison because of height differences. So what do the means look like if we focus on the modal height--5'4"?

Black 156.9
American Indian 149.7
Hispanic 142.6
White 141.7
Asian 125.3

A thirty pound difference between blacks and Asians, but again this is not really fair because of frame differences.

I also wanted to look at the age curve of women's weight:

age 18, 134
age 22, 137
age 26, 140
age 30, 143
age 37, 147
age 43, 150
age 51, 153
age 57, 156

From age 18 to 30, it only takes 4 years of aging to add an average of 3 pounds. So the 20s are the real weight gaining years, some of it due, I'm sure, to pregnancy.

After 30 the weight gain slows: it takes around 7 years to gain an additional three pounds until the peak weight of 156 is reached at age 57. After this age, the weight declines gradually and by age 82, women have fallen to the same weight they had at age 18. Some of this reduction is due to the higher mortality rates of obese women.

Sunday, January 07, 2007

Americans are the fattest people in the world: Nationmaster.com has data on obesity, and Americans are the big (emphasis on big) losers. I love my country as much as the next guy, but all this eye pollution does make me embarassed for us. And one of the few joys in life is to see pretty women during my otherwise unpleasant day. (I refuse to apologize for enjoying this--blame it on God if you like, I was born this way). It is getter harder and harder to find these girls since 1) they are all fat now, and 2) all the fat people block one's view.


It's natural to infer from this website that I am anti-immigration, but such an inference is wrong. I would love to see the country flooded with thin Asian women. But as you see from the rankings here, Mexico is not helping us: they're the number 2 fatties, and don't I know it.


Percent Obese

United States 30.6
Mexico 24.2
United Kingdom 23.0
Slovakia 22.4
Greece 21.9
Australia 21.7
New Zealand 20.9
Hungary 18.8
Luxembourg 18.4
Czech Republic 14.8
Canada 14.3
Spain 13.1
Ireland 13.0
Germany 12.9
Finland 12.8
Portugal 12.8
Iceland 12.4
Turkey 12.0
Belgium 11.7
Netherlands 10.0
Sweden 9.7
Denmark 9.5
France 9.4
Austria 9.1
Italy 8.5
Norway 8.3
Switzerland 7.7
Korea, South 3.2
Japan 3.2

Saturday, January 06, 2007

Mexican Americans do not want immigration from Latin America slowed: General Social Survey respondents (all were Americans) were asked if they wanted more or less immigration from various regions of the world. (They could also answer that they want levels to remain the same). Here is the percent wanting more broken out by large ethnic groups:

Percent wanting more immigration from Latin America
Blacks 9.4
English/Welsh 8.0
Germans 5.5
Irish 6.9
Mexicans 24.4

Percent wanting more immigration from Asia
Blacks 6.6
English/Welsh 9.7
Germans 4.0
Irish 9.5
Mexicans 25.0

Percent wanting more immigration from Europe
Blacks 8.5
English/Welsh 13.1
Germans 5.5
Irish 8.7
Mexicans 20.4

These numbers tell us at least two things. First, in forming their immigration attitudes, Americans generally do not think in terms of where immigrants are coming from--if you're for it, you're for it for everyone. Second, Mexican Americans are the most pro-immigration. They have the most immigrants and immigrant relatives, so this is no surprise. The above numbers do not show that Mex-Ams have a preference for Latino immigrants, but keep in mind that these questions (I think) were asked together, and a repsondent might feel awkward answering yes he wants more immigrants from Latin America, but then no when he is then asked about Asia or Europe. In America, we can't discriminate, right? Also, if Mex-Ams have a preference, it would be more for Mexicans than all Hispanics. Let's look at those wanting less immigration:


Percent wanting less immigration from Latin America
Blacks 39.2
English/Welsh 45.6
Germans 47.3
Irish 54.7
Mexicans 20.0

Percent wanting less immigration from Asia
Blacks 43.5
English/Welsh 42.3
Germans 45.6
Irish 49.1
Mexicans 34.1

Percent wanting less immgration from Europe
Blacks 34.0
English/Welsh 36.6
Germans 37.2
Irish 32.8
Mexicans 27.3

Not surprisingly, for all groups there are more restrictionists than open borders folks, and we see again that people are very simple in their attitudes. They don't think about things like how well do people from certain regions assimilate, or what characteristics, good or bad, do they bring. They want more or fewer immigrants, period. Mex-Ams have the fewest restrictionists, but we do see a little group solidarity slipping through in this second set of numbers: with Asia and Europe, Mex-Ams percentages are somewhat lower than the others, but the percent wanting less Latino immigration is less than half the other groups. Only 20% of Mex-Ams want fewer immigrants from Latin America. The more benign explanation is that they are thinking of relatives that plan to come to America in the future, but the more political explanation is that they see people like themselves freely coming and expanding the Hispanic presence here, and they like this trend, and don't want to see it diminish.

Wednesday, January 03, 2007

Welcome to multicultural America: As of two years ago, the bathroom I often visit on campus had nice, clean blue walls. Then, I began to see occasional gang writing here and there. My reaction was, "Gangs, at a university?!" (I really shouldn't be surprised: I have had former and current gang members in my classes). Over time, gangbangers wrote more and more, either to advertise themselves or to challenge rival gangs. Eventually, the walls were a mess of crossed-out graffiti.

Now, the latest trend. A couple weeks ago, some white guy finally got fed up with the bathroom's walls being turned into a giant scribble pad, and wrote: "F****** beaners." To which a well-endowed student responded, "Whoever said this can suck my big f****** Mexican c***." And today, the poetry continues with a "Get your a** back to Mexico, you f******* spic." I bet I can guess what's coming next: "This is our land, you f****** gringo. You get your a** back to Europe." (Do you think my dialogue sounds authentic?) As much as I enjoy the honesty of the john (I wish we could get this candor on the General Social Survey I analyze so much) I prefer clean walls. Welcome to multicultural America.

Update: I couldn't write this stuff. Today, I find that after two years, the walls have finally been cleaned. Did months and months of unsightly scribbling all over the place motivate a cleanup? No. Did the desire to take action against gang activity on campus motivate the cleanup? No. So what motivated it? Because someone wrote the word "beaner" on the wall.

Monday, January 01, 2007

English-speaking countries love pot: People in 26 countries were asked if they had ever tried marijuana (nationmaster.com). English-speaking countries came out on top, while sober Japan was WAY below everyone else. (Keep in mind that one reason the numbers are low is that a significant proportion of the samples are old people who grew up before the 60s). Interesting that Scandanavians love to drink but avoid drugs. And with a name like marijuana, only 1.3% of Mexicans ever tried the stuff? Strange. This is evidence that the U.S. is a bad influence on Mexicans: in an earlier post of mine, 9% of Mexican-American teens smoke pot at least weekly, and other surveys indicate that they use drugs more than whites or blacks.


Percent 15 and over who ever tried marijuana:

New Zealand 22.2
Australia 17.9
United States 12.3
United Kingdom 9.0
Switzerland 8.5
Ireland 7.9
Spain 7.6
Canada 7.4

Weighted average 5.8

Netherlands 5.2
Belgium 5.0
France 4.7
Italy 4.6
Greece 4.4
Germany 4.1
Denmark 4.0
Norway 3.8
Portugal 3.7
Czech Republic 3.6
Poland 3.4
Austria 3.0
Finland 2.5
Luxembourg 1.9
Hungary 1.2
Mexico 1.3
Sweden 1.0
Japan 0.05

Wednesday, December 20, 2006

I'm heading to snow country for a few days, but the dealer will be back soon enough to feed the numbers addiction in all of us. On an unempirical note, Merry Christmas.

Tuesday, December 19, 2006

The other blessings of economic freedom: If you just read my post right below this one, you might say to yourself that, ok economically free countries are rich, but they are both unequal and indifferent to the welfare of others. Wrong on both accounts: using the same sample I just described, I found that economic freedom is positively related to a willingness to help others (.57) and basically unrelated to income inequality (-.14). Evidently, markets create wealth, they distribute it broadly, and the wealth they create gives people the luxury to worry about the well-being of others.
Freedom and national wealth are empirically indistinguisable: Continuing my exploration of cross-national data, I noticed an extraordinarily large correlation between economic freedom and per capita GDP. Sample size was between 30 and 40, and the measures were normally distributed. The Pearson correlation was almost .90. Translation: national wealth and market freedom are almost empirically indistinguishable here. Where you have one, you will have the other.

Sunday, December 17, 2006

Discrimination, my ass: I have avoided commentary on this blog, figuring that the last thing the blogosphere needs is another fact-free gasbag, but after reading yet another "achievement gap" article, I really need to vent.

Students of the so-called prejudice problem obsess about race (thereby making ME obsess about race) but there are people with any number of traits that those in power might not want to help. The traditional power-holder has been a Christian, an English speaker, an American by culture, heterosexual, a member of a particular family, a man, and a white. An employer or professor, for example, might have something against people not matching himself in any of these characteristics.

So let's forget the facts for a moment and predict who would be at the bottom of the social ladder on the basis of the preceding points. He, or rather, she would be non-Christian, not good at English, not steeped in American culture, and not white. The woman who fits this desciption perhaps the best is Chinese. So is she at the bottom? Exactly the opposite of correct. She is more likely than a female member of any other American ethnic group to have a bachelor's degree or higher. In fact, according to the General Social Survey, the only men more educated than she are Chinese and Indian men. Discrimination, my ass.

Friday, December 15, 2006

Neo-Nazis are the most hated group in the world: The World Values Survey asked almost 17,000 people from 11 countries(Azerbaijan, Australia, Armenia, Brazil, Colombia, Dominican Republic, El Salvador, Georgia, New Zealand, Switzerland, Uruguay) which group they disliked the most. Here is the ranking:


Percent saying the listed group is most disliked:

1. Neo-Nazis/right extremists 26.9
2. Criminals 23.4
3. Guerrillas 9.2
4. Stalinists/hard-line Communists 7.0
5. Drug traffickers 5.5
6. Capitalists 5.2
7. Homosexuals 5.2
8. Immigrants 5.1
9. Para-military 3.7
10. Radical Maori activists 3.2
11. Anarchists/terrorists 2.0
12. Christians 0.6
13. Members of new religions 0.6
14. Kurds 0.5
15. Muslims 0.4
16. Jews 0.4

To Neo-Nazi folks: you know you are not very popular when the world has more regard for criminals, drug lords, and terrorists than for you. Evidently, your Jewish enemies are winning the PR campaign: they're at the bottom of the hate list. Keep in mind that three of the included countries are former Soviet satellites, and they inflated the anti-Nazi number some. Still, the Swiss, for example, are 3.6 times more likely to dislike most the hard Right compared with criminals (67.5% versus 18.6%). Myself, I'm much more fearful of some scumbag attacking my daughter than guys with shaved heads demonstrating for white rights, but maybe I'm odd.

Wednesday, December 13, 2006

Diversity breeds murder, inequality does not: A standard finding in criminological research is that homicide is strongly related to inequality: in societies with a big gap between the wealthy and the poor, the poor become resentful and take it out on nearby targets, also poor. This theory always seemed a bit of a stretch to me, the idea that I hate how the Man is screwing me, so I kill some guy at the bar for calling me queer. The theory turned every fist fight into something political. But the macrolevel correlation has been very reliable and very strong, I admit. A little investigation of mine evidently explains what is going on. Past cross-national studies always had a handful of Latin American countries with soaring homicide rates, and we all know that part of world reigns supreme in the rich-poor gap. So these outliers basically determined the size of the correlations. And yes, Latin murders are frequently political and tied to inequality.

But the whole situation changes with the sample I just constructed. I gathered the most recent homicide data for all countries that have published it. Data is now available from all the former Soviet countries. These are relatively equal countries, many of which have horrible violence of the organized crime type. When they are included in the analysis, the inequality-homicide link disappears.

Ethnic heterogenity, on the other hand, does have a significant influence on violence. The correlation between it and male homicide victmization rates is .41; for female victims, it's .48. Diversity breeds distrust and conflict, and can even lead to murder.

Tuesday, December 12, 2006

Do blacks bargain hunt as much as whites? This debate between Steve Sailer (I like) and Malcolm Gladwell (I'm indifferent to) has been very interesting. As is usually the case, my response to this sort of thing is what does the crystal ball (i.e., General Social Survey) say? Are blacks big spenders or bargain hunters, the same as whites?. (By the way, their reputation for cheapskate tipping suggests the latter). According to the GSS, 51.5% of whites (138 out of 268) who bought a car in the past 5 years chose a particular dealership because, after searching out the best price, they decided that it was the place to go. The number for blacks: 47.8% (22 out of 46). A small difference. As much as I'd hoped these data would back up Steve, there's not much evidence here. Keep in mind the black sample is small, and doing one's homework before buying a car is a bit different than face-to-face interactions with a salesman.

I'm pretty much a penny pincher, and I do seem to see quite a few blacks shop where I frequently shop: Walmart, dollar stores, Big Lots. I don't care that being seen there makes me look like a tight wad, and some blacks evidently feel the same. (Of course, this is anecdotal, and I don't know if blacks are truly over-represented or under-represented in these stores.).

Steve (and Posner) might be right, but the process of negotiating the price of a car is to some degree a battle of wits and manipulation, so wouldn't the IQ difference naturally come up as an explanation? If the opponent is weaker, the greedy salesman will exploit that. In the case of blacks it could be general intelligence. In the case of women, it could be less knowledge and haggling skills.
American Indians have poor vocabularies: Let's continue our look at ethnic groups who report multiple races. Among people saying they are American Indian (AI), they answered one of three races: white, black, other. Here are the mean vocabulary scores for these three categories:

Mean vocabulary scores (General Social Survey):

White American Indians 5.52
Black American Indians 4.65
Other American Indians 4.62

As we saw with Hispanics, more white ancestry is associated with higher scores, but having black ancestry does not lower the average. In fact, the average of all blacks is 5.01, so having AI ancestry lowers the scores of blacks. The pure AI average of 4.62 is lower than the non-white Hispanic mean of 5.34. So clearly, AI's do poorly on vocabulary tests. I imagine that some of this is due to low-quality environments--AI's often have worse indicators than blacks.

Sunday, December 10, 2006

Do race differences among Hispanics correlate with IQ? I calculated the mean vocabulary scores from the General Social Survey for the following groups:


Mean vocabulary scores for those born in America:

Non-Hispanic white 6.47
White of Spanish descent 5.81
White Hispanic 5.63
Non-white, non-black Hispanic 5.34

Race is self-described: many white Hispanics are actually mestizos. So we see here that this measure of IQ is positively related to how much European ancestry you have. But the gap between Spanish whites and whites from other countries is larger than any other. Spanish whites are more similar to non-white Hispanics than other whites? Perhaps the explanation is more cultural than genetic?

Saturday, December 09, 2006

Support for defective fetus abortions are on the decline


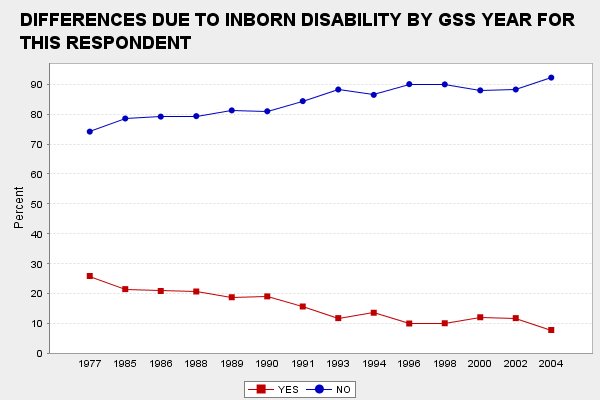
After reading's Razib's post on eugenics, I wandered what the trends are in approving of an abortion if there is a good chance of a birth defect. It turns out that support has been dropping for a decade. The percent approving went from 81.8% in 1996 to 72.9% in 2004. 2002-2004 was the biggest two year drop, and I'd be interested to see the 2006 numbers. The samples were all over 850 people, so the numbers should be fairly accurate. Of course, approval numbers are still high, but as genes moves front stage, we might see some backlash.
Men have more energy than women: As a follow-up to the last post, I thought I would compare men and women on energy levels. For men, the mean 3.22, and for women, it's 2.90. To give you an idea of the size of the difference, it's 1/4 of a standard deviation. Women do seem to complain a lot about how tired they are, but then where's the survey question about how much do you complain?

Friday, December 08, 2006

Which ethnic group has the most energy? Americans were asked how much energy they had the past month (General Social Survey). Answers ranged from all the time (1) to none of the time (6). I calculated the mean answer for the large ethnic groups and subtracted it from 6 so that high numbers indicate having abundant energy:


Mean energy score:

Mexicans 3.38
Jews 3.26
Germans 3.16
Italians 3.14
Blacks 3.10

USA 2.97

Irish 2.97
English 2.85
American Indians 2.77

The American Indian estimate squares with my experience, but I am surprised that the black mean is above average. On the other hand, no one works harder to get their grades changed than black students. And don't accuse me of suppressing stats that make Mexicans look good.

Update: I promised myslef that I would include Jews (a religious, not ethnic group in the General Social Survey) when analyzing ethnic differences, and, just like me, I immediately forgot. Their mean energy score is 3.26, so this is a active group, behind only Mexicans.

Wednesday, December 06, 2006

Mexican-Americans are the most arrested of all ethnic groups: In my post on bad behavior, readers would have liked to see more ethnic groups and more serious behavior. Crime was suggested, so let's look at the percent ever arrest. Let's set the minimum sample size to 50:


Percent ever arrested (sample size in parentheses):

Mexicans 17.4 (195)
Spanish 17.2 (64)
Blacks 16.4 (714)
French Canadians 16.3 (92)
American Indians 14.6 (315)
Italians 14.2 (508)
French 13.2 (189)
Scots 11.5 (278)

USA 11.1

Puerto Ricans 11.0 (73)
Danes 11.0 (73)
Irish 10.4 (969)
Germans 10.2 (1,613)
Swedes 9.6 (146)
English/Welsh 8.8 (1,213)
Russians 8.4 (155)
Poles 8.3 (291)
Czechs 8.3 (121)
Hungarians 7.9 (76)
Dutch 7.8 (153)
Austrians 6.5 (77)
Finns 5.3 (75)
Jews 5.1 (237)
East Asians 1.7 (60)

Since some samples are small, it's advisable to look for regional patterns. Poor non-whites are toward the top of the list. So are those from southern European countries. In the earlier post on bad behavior, Catholics did poorly, but here it's more divided: southern Europeans are arrested at high rates, but those from central and eastern Europe are very law-abiding (Poles, Czechs, Hungarians, and Austrians). The Irish fall into the middle ranks. Northern Europeans have few arrests, except for those angry Scots--a trait that gets you arrested. Jews are second from the bottom: they didn't do as well on my "bad behavior index" because they had high numbers on things that don't get you arrested: thinking cheating on taxes is okay; ethnocentricity; homosexuality; infidelity; and promiscuity. East Asians were Chinese, Japanese, and Filipinos combined. Only one person in the sample (Filipino) reported an arrest. The sample is still small, and I don't know about you, but I think the estimate is basically correct.

Tuesday, December 05, 2006

Are smart people crazier? A reader asked if I would look to see if smarter people are more likely to be mentally ill. (Please, if you ever want me to see what the numbers say about anything, just ask). Using General Social Survey data, the mean vocabulary score for those ever having a mental problem is 7.25 (the range is from 1 to 10). For those reporting no problem, the average is 5.98: smarter people are definitely at risk. Surprisingly, the gap narrows for actually receiving help: the average of those who have sought counseling is 6.69; 6.18 for those who never have.

Myself, I must be smart as hell 'cuz I'm one crazy bastard.

Sunday, December 03, 2006

WASPs rule! I wrote in a recent post that I was getting the sense that Americans with Protestant European backgrounds were the best behaved. So I decided to sum all my prior post numbers that dealt with ethnicity and moral behavior to assess this idea systematically. I followed the simple strategy of assigning a rank for each behavior for each of the 8 ethnic groups with sufficiently large sample sizes. Jews were often ignored in previous posts since one must turn to the religion rather than the ethnicity variable to get estimates, but I wanted to include them, so I calculated numbers and then ranks for them.

I included all variables that I have posted on--here's a list of them: okay to cheat on taxes; drinks too much; ethnocentric; dirty house; frequents prostitutes; promiscuous men over 30; feel that infidelity is not wrong; gay; lesbian; husbands and wives who cheat; fathers divorcing mom; women arrested; and promiscuity for men and women and under. I realized that I had not posted on drug abuse so I added that to the rest. I ranked group so high numbers indicate more bad behavior, then I simply summed the 16 rankings for each ethnic group. Here are the totals:


Bad Behavior Index

Blacks 106
Mexicans 85
American Indians 85
Italians 70
Irish 67
Jews 64
Germans 56
English/Welsh 47

My hunch was correct. This pattern coincides with that feeling that goes way back among nativists that the moral quality of the country was slipping with the mass immigration from Catholic, southern and eastern European countries, and more recently in concern over immigration from Mexico.

Thursday, November 30, 2006

Miami is like a Third World country: Governor Jeb Bush got huffy the other day when Tom Tancredo said that Miami is like a Third World country. Bush and other Florida lawmakers responded with the usual doublespeak, using words like "hospitality" and "vibrant."

Like always, we must ignore what the politicians say, and must rely on data. According to the Census, here is how Miami compares to the rest of the country:

Percent Hispanic
Miami 65.8
USA 14.1

Percent speaking something other than English at home
Miami 74.6
USA 17.9

Percent of people ages 25+ with high school degree
Miami 52.7
USA 80.4

Homeownership rate
Miami 34.9
USA 66.2

Percent poor
Miami 28.5
USA 12.5

Let's see: the city is a place where most people are Hispanic, Spanish-speaking, 1/2 never finished high school, few own homes, and many are poor. Sounds like the Third World to me. And it's coming to your neighborhood next.

Tuesday, November 28, 2006

Who's crazier: blacks or whites? The General Social Survey asked respondents if they had ever experienced a mental health problem. The only two groups large enough to examine are blacks and whites, and 5.3% and 7.7% said yes, respectively. These numbers parallel the racial pattern of suicide. Now, the racial activists tell us that are society is rife with racism, but if that were the case wouldn't mental illness be much more common in blacks? If I were surrounded every day by people who hate me, it might very well take its toll on my sanity. You might respond that prejudice is indeed pervasive, but blacks possess the mental strength to overcome it and even surpass whites in psychiatric health. But oops--now you have violated your own taboo against positing natural mental differences between races.
Other data indicating that Mex-Ams are ethnocentric and strongly tied to Mexico: In earlier posts, I presented evidence from the General Social Survey (GSS) that Mexican Americans are comparatively ethnocentric. Another way to look at it is to see how many of them see themselves as "American only"--people with no roots anywhere except for here. According to the GSS, Mexicans are 5.2% of the population but are only 2.3% of those saying they are only American. Blacks, for example, are much more likely to say yes to this question, even though they could easily identify with Africa if they chose to.
Which Americans have the most sex partners? General Social Survey participants were asked how many different partners they had in the past year. I calculated the mean for 18-30 year olds from ethnic groups with at least 100 respondents:


Mean sex partner in last 12 months (women in parentheses, then the sex difference):

Blacks 2.39 (1.44) +.95
Irish 1.92 (1.36) +.56
Italians 1.85 (1.19) +.66
American Indians 1.83 (1.38) +.45
Mexicans 1.73 (1.48) +.25

USA 1.74 (1.32) +.42

Germans 1.53 (1.21) +.32
English/Welsh 1.51 (1.28) +.23

Blacks have been characterized as the most sexual race, but according to GSS data, this is more true of black men. Mexican American women report more partners than do their black counterparts. Other surveys portray black women as being somewhat conservative about sex. And while other studies also suggest that blacks have more partners, they often do not find that blacks have sex more often, or that they engage in more novel kinds of sex (e.g., anal). In a well-respected study described in the Social Organization of Sexuality, Hispanics had the most sex, and were the most experimental.

The women's rankings tend to follow the men's: the number of partners a woman has are, in part, due to the kind of men she is dealing with. If she is sleeping with someone, she probably wants to keep him, and if she is sleeping with multiple guys in a year, the guys are not sticking around. There is also a pattern of more gender-traditional groups having the biggest sex differences (Italian guys can sleep around, but not the girls).

As we have seen with many kinds of behavior that grandma wouldn't like, rates are highest among non-whites, or among whites from Catholic or southern European countries. (Drinking is an important exception). You and I might not think any group is ultimately superior to another, but Grandma is starting to think that whites from traditionally Protestant countries (and perhaps East Asians and Jews if I studied them more) are.

Friday, November 24, 2006

GSS data cast doubt on the idea that immigrants will shift our values right: Will Mexican immigrants bring a more Catholic tinge to politics? General Social Survey respondents were asked if they approved of abortions for any reason. Below is the percent difference between groups:


Percent difference in approving of abortion for any reason

Mexican Immigrant--All Americans, -17.2%
American-born of Mexican ancestry--Total American-born (ages 26+), -10.1%
American-born of Mexican ancestry--Total American-born (<25), -2.9%

Indeed, Mexicans immigrate with views less favorable to abortion than the average American, but in subsequent generations and among younger Mexican Americans, the gap closes. From these data, America shapes the moral values of immigrant families more than the reverse. These data also say poppycock to neocons who argue that Latinos will move the country in a traditional direction.

Thursday, November 23, 2006

Poor Americans are not poor: Thanksgiving Day has got me thinking about abundance and poverty. Students moan in my class about how poor so many Americans are. I looked at the American Community Survey to see what percent of poor Americans own a house. According to the 2000 sample of 52,830 of Americans making less than $20,000 annually total household income, 30.4% own a house free and clear, 17.8% own with a mortgage or loan, and 51.8% rent. The modal home owned has 3 bedrooms. A Third Worlder would giggle if you told him that 1/2 of poor Americans owned a house with 3 bedrooms. That ain't poor, baby.

Wednesday, November 22, 2006

Is the unemployment-crime link stronger for blacks or whites? In his latest VDARE column, Steve Sailer writes that young, black men are more likely to cause trouble if unemployed compared to other groups. (This was not his main topic, but even his small points are food for thought). In my mind, it could go either way: unable to make a living, the young black man turns to crime while the young white guy sits in his parents' place playing with his new Playstation 3; or a white guy who doesn't have a job is, on average, more troubled and more likely to commit crimes than the unemployed black guy who lives in an envirnoment where not having a job is not that unusual.

I looked at General Social Survey males ages 18 to 22 and compared "active" and "inactive" blacks and whites--"active" means working part- or full-time or in school. Twenty-five percent of active whites report having been arrested compared to 45% of inactive whites. For blacks, arrest rates are 40% for actives and 50% for inactives. From these numbers (and we should view them with caution since the sample size is only 391) an inactive status differentiate whites in terms of criminal behavior more than it does blacks. As with all correlational research, the causal relationships here are difficult to identify. Based on these data, I would say that inactivity is a measure of certain personality traits (e.g., shiftlessness) that lead to crime, and the measure is more valid for whites than blacks.

Tuesday, November 21, 2006

Lynching is ancient history


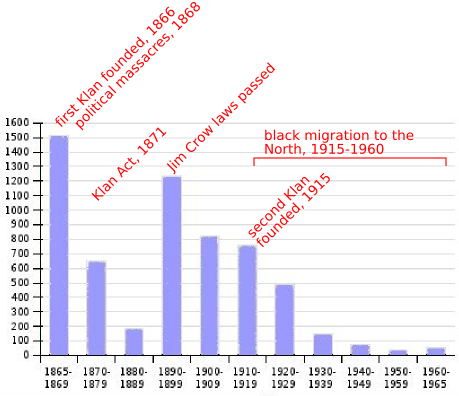
An anonymous reader cited statistics in my earlier post, presumably to show that lynchings were a larger problem than I indicated. My main point was not that lynching was not a serious problem, but rather that most incidents happened prior to 1950. Allow me to comment on the reader's numbers. The first study he cites by Raper is for the years 1989 to 1930. The period from the 192os to the 1930s saw a huge decline in lynchings. This is shown in the above graph. The whole decade of the 1950s--a troubled time for race relations--experienced only 6 black executions. This was the point of my post: there have been very few black lynchings in the last 50 years. Race activists paint a picture of America that has been murdering blacks up until the week before last, but you have to go back 80 years before you find 50 of these victims in a year among a population of over 10 million people.
Let's get some perspective here. With 6 lynchings in the decade of the 50s with 15 million blacks, the annual risk of this kind of murder was .00399 per 100,000 blacks. According to the CDC, the risk of murder for blacks--a crime usually perpetrated by another black--was 21.7 per 100,000 in 2003 (most recent year available). That risk is 5,439 times higher than the risk of being lynched in the 50s. Even if some lynchings were never recorded, there is no possible way that these two risks are in the same ballpark.

I also notice some things in the numbers cited. An accusation of rape was generally not the motivation for the killing, so it is myth that lynchings were motivated by whites who were hysterical about black male/white female sexual contact. In the two cites, lynchings of whites are not directly discussed. According to the source I cited (evidently the same source used by Wikipedia which was also cited) over that same period of 1882-1968, 27.4% or 1,297 of lynch victims were white. It is convenient to ignore white victims since it is easier to portray this phenomenon as pure, rabid hate crime instead of something much more complicated.

Monday, November 20, 2006

How common were black lynchings 50 years ago? After watching what seemed like an hour-long press conference on CNN--the most trusted name in news--where Paul Rodriguez (a co-owner of the Laugh Factory where Michael Richards performed) argued with a foaming-at-the-mouth black audience over the Richards flap, my principal reaction was "Michael Richards is Jewish? I didn't know that."

Later, I wondered if it were true, as Richards said, that fifty years ago a disrespectful black man would find himself "upside down with a fork up his ass." Precisely, how common was lynching in 1956? According to the Tuskegee Institute, the exact number of cases in 1956 was ZERO .

Saturday, November 18, 2006

Mexican women are the most criminal in America: I've looked at crime before on this blog, but have not focused on female criminality. Here are the percent who reported to the General Social Survey that they have ever been arrested:


Percent of American women arrested (sample size in parentheses):

Mexicans 9.3 (108)
French 6.1 (114)
Blacks 5.9 (404)
Italians 5.6 (269)
American Indian 4.8 (187)
Germans 4.7 (844)

USA 4.6 (4,626)

Scots 4.6 (131)
Irish 4.5 (581)
Poles 3.8 (159)
English/Welsh 2.8 (647)

I swear I'm not making this up: Mexican women have rates higher than any other group. Blacks and Southern Europeans also have high numbers, while other Europeans and American Indians are average or low.
Many blacks say that Jews are "bloodsuckers": Just about the only American not (weakly) portrayed as an anti-Semite, homophobe, or Jesus freak in "Borat" was the angelic black prostitute who eventually became the protagonist's wife. Yes, blacks remain the icons of humanitarian virtue.

The Survey of Chicago African Americans asked 639 blacks the following question: "Louis Farrakhan, the head of the Black Muslims may be a little extreme to describe Jews as 'blood suckers', but there's a lot of truth to it all the same. Do you agree strongly, agree somewhat, disagree somewhat or disagree strongly?"

One-third said they agree (strongly or somewhat). You're going to have to go to Stormfront.org to get a higher number than that.

Thursday, November 16, 2006

Evidence that Mexicans are the most ethnocentric group in America: As I just wrote about, the General Social Survey asks respondents about their ethnicity and records a second ethnic group if you mention one. If you don't mention a second, they record again the first ethnicity you mentioned. While most Americans have a mixed family tree, many feel a connection to just one branch. This varies by primary ethnic group. Let's see what percent report no identity except their main one:


Percent saying they have only one ethnicity

Mexicans 73.9
Blacks 51.6
American Indian 51.6
Italians 41.5
French Canadians 35.8
Yugoslavs 34.0
Norwegians 33.2
Irish 32.1
English/Welsh 29.9
Czechs 26.0
Poles 25.8
Scots 23.6
Finns 23.5
Swedes 22.9
Austrians 22.6
Russians 21.4
Portuguese 20.6
Danes 20.2
Hungarians 20.2
Germans 19.6
Dutch 17.8
Rumanians 17.4
Lithuanians 15.6
French 14.5
Greeks 14.3
Swiss 12.7
Spain 12.6

Non-whites are much more likely to see themselves as belonging to one group, and as we saw in the earlier post, on the rare occasion when they report a second ethnicity, it is also typically non-white. Mexicans take the lead: most are Mexicans and nothing else. Mexicans are more Mexican than Blacks are Blacks. While many of us see ourselves as multi-ethnic, here is evidence of strong Mexican ethnocentricity.

Wednesday, November 15, 2006

We are all Germans now: Many of my posts deal with American ethnic groups, but I always treat people as though they belong to one group. The General Social Survey recorded if respondents mentioned belonging to a second ethnic group. Here are their answers--the first is the main identity, the second is the most common second identity given, along with the percentage saying so:


Percent saying that the second group is their secondary ethnicity

Black--American Indian 25.8%
German--English/Welsh 20.6
Irish--German 19.3
English/Welsh--German 19.9
Mexican--American Indian 5.7
Italian--Irish 13.2
Scottish--English/Welsh 24.9
Austrian--German 25.0
French Canadian--Irish 22.6
Czech--German 22.0
Danish--German 19.3
Finnish--German 17.6
French--German 19.7
Greek--German and Italian 19.1
Hungarian--German 17.1
Dutch--German 25.0
Norwegian--German 23.7
Polish--German 17.2
Russian--German 28.3
Spanish--Mexican 36.3
Swedish--German 20.1
Swiss--German 40.5
American Indian--Black 14.3

The first thing that jumps out at me is how common German is as a secondary identity! Of course, this is a large American group, but I can't help thinking that perhaps Germans have been very open to intermarrying, or that of the many ancestries that mutt Americans have, German is one that is remembered for some reason. It is also interesting that poor minority groups only have some other poor minority group as their secondary ethnicity.
Spirituality is unrelated to education: I assumed that intelligence would be positively correlated with "feeling connected with all life." While unintelligent people have strong feelings for specific friends, relatives, or enemies, I imagined that only smart people would feel a bond with an abstraction. I was wrong: according to the General Social Survey, the correlation between years of education and feeling connected is a whopping .02.
Do men and women differ in spirituality? Just a few posts below, I looked at how spiritual various ethnic groups are. Let's compare men and women now.


Men

Mexicans 3.12
Blacks 3.11
American Indians 3.05
Scots 3.00
Irish 2.98

USA 2.80

English/Welsh 2.67
Germans 2.66
Italians 2.52


Women

Scots 3.63
Blacks 3.33
English/Welsh 3.17
American Indians 3.16
Germans 3.15

USA 3.11

Italians 3.07
Mexicans 2.68
Irish 2.83

First, we can see that women are more spiritual than men, but the differences appear to be smaller than with church attendance (earlier post). Comparing ethnic groups, Mexican men are comparatively spiritual, but Mexican women are not. The pattern is similar but less striking for Irish Americans. The pattern is reversed for Germans and English/Welsh. But we can't make to much of small differences since sample sizes are small.

Tuesday, November 14, 2006

Religious involvement by sex and ethnicity: Steve Sailer suggested I post on the gender differences in spirituality and religious attendance. Let's begin with the latter. Here are mean scores broken out by ethnic group and sex:


Men

Blacks 3.95
Mexicans 3.91
Irish 3.62
Germans 3.57

USA 3.55

English/Welsh 3.44
Italians 3.39
Scots 3.29
American Indians 3.21


Women

Blacks 4.83
Mexicans 4.51
English/Welsh 4.25
Scots 4.29
Germans 4.25

USA 4.25

Irish 4.23
American Indians 4.23
Italians 4.00

While the ranks are similar for the two sexes, Irish men rank a little higher than the women, while Scottish and English women rank higher than their male counterparts. Dragging your partner to church might be one factor that makes men and women similar. Another is selecting someone like yourself for a partner.

Notice how the least religious women (Italians) are more churchgoing than the most religious men (Blacks).

Friday, November 10, 2006

More on spirituality: I just posted on the topic of ethnicity and feeling connection to all life, and it made me wonder how much of an overlap there is between spirituality and church attendance. According to GSS data on 1,271 people, the correlation between the two is .27. Note that, as a rule, correlations based on survey data are disappointingly low, so relatively speaking, this ain't too shabby. Here is the list of mean church attendance by ethnic group (3=several times per year, 4=once a month):


Mean church attendance score

Blacks 4.44
Mexicans 4.22
Irish 3.97

USA 3.93

Germans 3.92
English/Welsh 3.87
Scandanavians 3.86
Scots 3.77
Italians 3.71
American Indians 3.70
East Asians 3.58

Across the 10 groups, the rank correlation (Spearman's rho) for spirituality and church attendance is .32. Certain groups lower the correlation: the Irish are church-goers but are not spiritual, and Scots and American Indians are spiritual but don't go to church much.

Update: On a related topic, what is the distribution of church membership among American Indians? Three-quarters are Protestant, 9 percent are Catholic, 11 percent have no religion, and only .6 percent report a Native American faith.
Which American ethnic group is the most spiritual? GSS respondents were asked how often do they experience a connection to all life. Answers range from never (=6) to many times a day (=1) (many times a day?!) I calculated mean scores for ethnic groups with at least 30 cases and subtracted this number from 6 so that higher numbers indicate greater spirituality:


Mean spirituality score (sample size in parentheses):

Scots 3.29 (42)
Blacks 3.26 (82)
American Indians 3.12 (58)

USA 3.04 (1,000)

English/Welsh 2.95 (137)
Mexicans 2.91 (61)
Germans 2.90 (151)
Irish 2.90 (138)
Italians 2.80 (54)
Scandanavians (Danes, Norwegians, Swedes) 2.78 (36)
East Asians (Chinese, Japanese, Filipinos) 1.92 (26)

I was under the impression that Scandanavians and East Asians were sober people, so I combined national groups so samples were larger. I was right, espeically with Asians: they fall to the bottom of the list. Blacks in second place seems right: they are not a sober people. The Scots in first place does seem odd, however.

Tuesday, November 07, 2006

Who has the most good friends? I was interested to know which American ethnic groups say they have the most close friends. According to the General Social Survey, this is the mean number reported:


Mean number of close friends (sample sizes in parentheses):

Norwegians 12.7 (32)
Scandanavians 9.7 (60)
Germans 7.8 (198)
English/Welsh 7.7 (198)
Mexicans 7.4 (38)

USA 7.2

American Indians 7.2 (43)
Irish 6.9 (167)
Poles 6.2 (54)
Blacks 6.1 (91)
Italians 5.0 (75)

This is not the pattern I expected. Comments?

Saturday, November 04, 2006

Mexican women second most concerned about women's rights: Americans were asked by the General Social Survey (GSS) how important women's rights were to them. Answers ranged from "not at all" (=4) to "one of the most important issues" (=1). I calculated the means for women from ethnic groups with sufficiently large samples. I subtracted the means from 4 so that higher numbers indicate greater feminism. Here they are:


Mean feminist score

Blacks 1.94
Mexicans 1.91
American Indians 1.83
Italians 1.82
Germans 1.70
Irish 1.74
English/Welsh 1.58

It is interesting that the women from the most gender-traditional ethnic groups are the ones most concerned about women's issues. There are at least a couple possible reasons for this: 1) these groups are poorer and more liberal, and feminism goes with liberalism; and 2) these groups have the worst behaving men.

But I thought Mexican women were paragons of traditional family values? These women may not be advanced feminists of the you-must-be-a-lesbian-to-be-liberated type, but evidently they won't be voting in sync with Focus on the Family.

Saturday, October 28, 2006

Latin American countries are the most criminal in the world: In response to my point that the U.S. does not have a high property crime rate as predicted by popular theories that claim that love of the market breeds crime, a reader argued that the U.S. would have a high rate if not for astronomical rates of incarceration (the adjective I would use is appropriate). Let's set aside the United States for a moment and look at the rankings of national robbery rates around the world (International Crime Victimization Survey) :

Percent robbed last year

Brazil 11.3
Colombia 10.6
Paraguay 6.7
Argentina 6.6
Tunisia 6.3
Bolivia 6.2
Costa Rica 5.8
Zimbabwe 4.8
South Africa 4.6
Uganda 4.4
Spain 3.1
Philippines 2.4
Botswana 2.0
Egypt 1.9
Polish 1.8
Italy 1.3
England/Wales 1.2
Australia 1.2
Indonesia 1.2
Portugal 1.1
France 1.1
Belgium .9
Sweden .9
Canada .9
China .9
Netherlands .8
W. Germany .8
India .8
Switzerland .7
Denmark .7
New Zealand .7
Scotland .7
USA .6
Finland .6
Norway .5
Austria .2
Northern Ireland .1
Japan .1

According to anti-market theories, countries with the greatest economic freedom should have the most theft. But the 10 worst countries have weak to terrible rankings on economic freedom (www.heritage.org). Costa Rica is the best at 46. With the exception of India, the 10 countries with the lowest levels of robbery are highly ranked on economic freedom. The only one who doesn't make the top tier is Japan, and its rank is 27th. If anything, a market orientation reduces theft.

Criminologists love to find an appealing theory that suits their politics. They don't bother to look at the data first. Anti-market theories have reigned in sociology and criminal justice classes for decades, with the one little problem of having no empirical validity.

In the spirit of the name of this blog, what do these data points lead us to conclude concerning the cause of national levels of violent theft? Rates are highest in Latin America and lowest in Europe and Japan. This looks like a simple case of wealth except that Latin American countries are richer and yet more thieving than sub-Saharan African countries. Plus, China and India have low rates. Spain has the highest European rate, and the Tunisian rate is very high.

What about distributions of traits? Hispanics have higher IQs than Africans. The rankings on extraversion, based on a recent post by Agnostic at gnxp.com, don't line up all that well with robbery (although if there is one thing a robber needs to be, it's bold).

Let me complicate things by adding that in my previous post on burglary, Africans exceeded Latin American countries. Is there some reason why Africans would prefer breaking into houses, while Latinos prefer mugging people? Housing in Latin America is more secure?

What is it about Hispanics? Machismo? Any ideas? I did not plan this at all, but isn't it funny how so many of my analyses make one wonder if mass immigration to the U.S. from the south is such a great idea? Now the Tamar Jacoby's of the world will say that Hispanic immigrants have low rates of crime, but she is looking at a little selective slice of the Latin population--an above-average behaving slice. The criminal mean for this international population is very high, and the American descendants of these immigrants regress to that very high mean.

Friday, October 27, 2006

Mexicans are (almost) least in favor of free speech: One important indication of assimilation to American society is a belief in free speech. Nothing upsets me more than to hear about some eccentric locked up in a European prison for saying wacky things like there was no Holocaust. They won't lock up actual criminals, but are only too happy to imprison people who say the wrong thing. So let's see which ethnic groups are best assimilated in terms of free speech values. The General Social Survey asked Americans if they feel that anti-religionists should be allowed to speak in their communities. Here is the percent who said yes:


Percent saying anti-religionists should be allowed to speak

Hungarians 81.5
Greeks 79.6
Russians 79.2
Scots 78.9
Yugoslavs 78.2
Swedes 77.8
French 77.3
Norwegians 77.0
Lithuanians 76.5
Filipinos 76.5
English/Welsh 75.4
Italians 74.5
Japanese 73.8
Danes 73.0
Swiss 72.8
Poles 72.8
Irish 72.7
Germans 71.4
Spain 71.4
Finns 71.3

USA 71.2

Belgians 70.7
French Canadians 69.5
Chinese 67.7
Czechs 67.7
Rumanians 67.4
Austrians 66.9
Portuguese 66.2
West Indians 66.0
American Indian 65.1
Blacks 64.8
India 63.2
Arabs 62.5
Mexicans 62.0
Netherlands 61.2
Puerto Ricans 59.3

Roughly speaking, whites and Asians are free speechers, others less so. This, with other evidence I've seen, suggests that white immigrants assimilate best to American society, with Asians being an exception to the rule. Blacks and American Indians show how difficult it can be for non-whites to adopt American ways: they have had hundreds of years to develop a belief in free speech, but have been left behind by even the most recent immigrants. And speaking of recent immigrants (I can never pass up the opportunity to address the Mexican question) Mexicans are almost at the bottom of this list. In an earlier post, they had a similar ranking on the question about allowing racists to speak in public. As Hispanics become a more powerful influence at the ballot box, we might see the day where the things I am writing on this blog could get me a long stretch in the pen.

Monday, October 23, 2006

No surprise: poor people steal the most: Continuing our look at the International Crime Victimization Survey, are the rates of property crime the highest in poor countries or wealthy countries? According to rational choice theory, crime pays more and more as one's legal opportunities for income are diminished. By contrast, routine activities theory claims that property crimes will flourish in places where desirable targets are abundant. A lot is stolen because there is a lot to steal. I list here the percent of all respondents whose dwelling was burglarized in the past year:

Tanzania 19.0
Uganda 11.7
Zimbabwe 10.7
Botswana 10.4
Paraguay 8.2
Costa Rica 7.3
Tunisia 7.2
Bolivia 6.7
South Africa 6.3
Columbia 6.0
Argentina 5.5
New Zealand 4.3
Indonesia 3.9
Australia 3.9
Denmark 3.1
England/Wales 2.8
Egypt 2.6
Italy 2.4
China 2.3
Philippines 2.0
Belgium 2.0
Poland 2.0
Netherlands 1.9
Brazil 1.9
USA 1.8
North Ireland 1.7
Sweden 1.7
India 1.4
Switzerland 1.1
Spain 1.6
Scotland 1.5
Portugal 1.4
Catalonia 1.3
West Germany 1.3
Japan 1.1
France 1.0
Austria 0.9
Norway 0.7
Finland 0.3

The evidence here supports the rational choice view: the worst 11 countries are all poor. (India is an exception, and the number for Brazil is lower than expected). Of course, I haven't mentioned all possible explanations. It might be that countries with lots of crime and poverty have many people with certain traits. An example would be a low average IQ. Sociopathy, impulsivity, present orientation, or laziness are among the other possibilities.

For those familiar with the criminological literature, one of the most interesting numbers is the United States. According to at least two popular theories--strain and institutional anomie--America should lead the world in property crime because it is unique in its worship of the market. Sorry guys--as much as you'd like to vilify the American system and conservatism, the U.S. is mediocre, even among wealthy countries.

Friday, October 20, 2006

A worldwide survey of victims shows racial differences in crime: In Race, Evolution, and Behavior, Phillip Rushton used international law enforcement data (Interpol) to show that blacks globally have higher rates of criminal violence than Asians. Critics have pointed out that the data were collected by disparate national systems, and that Interpol itself says that the data are not comparable. A better approach is to use data from the International Crime Victimization Survey. This survey publishes estimates of crime from nationally representative samples of respondents who are given a list of crimes and are asked if they have been a victim in the past 12 months. Here are the prevalence rates (the percent of the population victimized in the past year) for "assault with force" for the latest year available:

Zimbabwe 6.7%
South Africa 4.6
Botswana 3.7
Uganda 2.4
Indonesia 1.1
China 0.9
Philippines 0.4

This kind of survey data is much more persuasive evidence of worldwide racial differences than officially recorded violent crimes.

Thursday, October 19, 2006

Europeans are gender stupid: The World Values Survey asked people if they agreed that fathers are as well suited to caring for children as mothers. The sample is basically Europe. Three-quarters of the sample agreed or strongly agreed. The reigning idiots are Swedes: 92% believe daddies and mommies are naturally interchangeable caregivers. Common sense emerges as we descend southward: only 64% of Greeks think this way. People seem equally thick east to west, although more Russians (82%) see things this way than British (71%).

Tuesday, October 17, 2006

Message to liberals: you don't have to be like your hero Clinton in every respect: It's been a long time since I made liberals look bad, so let's find something--it's not difficult. The data tell us that liberals cheat on their spouses more than conservatives: here is the percent unfaithful in the past year (GSS data):

Extreme liberals 9.1%
Liberals 4.6
Slight liberals 4.1
Moderates 3.1
Slight conservatives 2.7
Conservatives 2.7
Extreme conservatives 3.1

I'm stunned. I thought conservatives were heartless beasts, while liberals will shed a tear if someone steps on a flower. Well, maybe crushing the person you're supposed to care about the most isn't so bad, I mean sexual fulfillment is the greatest thing life has to offer, right? Like I heard on the radio the other day: some liberal said he would bet that the shooter of those Amish children was a Republican. Translation: conservatives love kill people, and liberals love to love people. Yeah, your wife while you're at work.

Saturday, October 14, 2006

Sexual dimorphism differences across races? I've read that sexual dimorphism is positively correlated with polygyny and less paternal investment, so I looked to see if this might be true across human races that are known to differ on these things. Wikipedia lists height studies from all around the world, so I calculated the percent differences in height between males and females for all available black and Asian samples. The results:

American blacks 8.41%
Japan 7.60
South Korea 8.13
Taiwan 7.72
Singapore 6.21

Male-female differences are consistently smaller for Asian groups than for blacks, but not by much, so interpret as you will.

Friday, October 13, 2006

USA close to world average on wanting authoritarian leader: In Fred Reed's current column, he suggests that America is vulnerable to a shift to authoritarian rule: if President Bush decided to stay in office past his time, who would stop him? No one has stopped him on anything so far.

The World Values Survey asked people if they thought that having a strong leader who doesn't bother with parliament or elections is a good idea. Here is the percentage who answered "very good" or "fairly good":


Vietnam 99.4
Macedonia 73.8
Romania 66.6
Moldova 62.5
Philippines 62.5
Kyrgyzstan 60.6
Brazil 60.5
Ukraine 59.6
India 59.1
Mexico 56.2
Lithuania 55.9
Armenia 53.5
Russia 48.8
Venezuela 47.9
Latvia 47.9
Bulgaria 47.6
Luxembourg 45.0
Chile 43.0
Nigeria 42.6
Argentina 41.7
Jordan 40.5
Colombia 40.3
Belarus 40.3
Algeria 39.1
Iran 39.1
Peru 38.5
Portugal 36.9
Bosnia/Herzegovina 36.6
France 35.2
South Africa 34.2
Pakistan 33.8
Belgium 33.3
Puerto Rico 33.2

World 32.8

Uganda 30.1
USA 29.5
South Korea 28.3
Japan 28.0
Ireland 26.9
Netherlands 26.8
Finland 26.5
Austria 25.6
Great Britain 24.9
Australia 24.8
Slovenia 23.9
Canada 23.2
East Germany 23.0
Singapore 22.6
Poland 22.2
Hungary 21.5
Sweden 21.5
Iraq 19.9
Slovakia 19.8
New Zealand 19.6
Serbia 19.4
Indonesia 19.3
N. Ireland 19.2
Malta 19.1
Morocco 19.1
Spain 19.1
China 18.5
Estonia 18.3
Albania 17.3
Czech Republic 16.7
Italy 15.6
Montenegro 14.8
West Germany 14.5
Denmark 13.9
Croatia 12.1
Bangladesh 11.6
Iceland 10.5
Greece 8.7
Egypt 7.7
Tanzania 2.6

We see that there is a long list of countries less comfortable with the idea of strong man rule than the United States (although some of them are far from actually being democratic). The U.S. survey was conducted in 1999, so it does not reflect post-9/11 feelings.

I also looked at which Americans were most likely to express favorable views. Sex, religion, and religious attendance did not matter, but 43% of the people in the lowest of three educational categories thought a non-democratic leader was a good idea, and 37% of people ages 15-29.

Wednesday, October 11, 2006

My students are certain that rich people are evil: My students will sit placidly through all sorts of controversial things I say in class; that is, until I say something to the effect that rich people are not monsters. They believe with religious zeal that elites live to see little guys suffer. They make me feel like some sort of traitor when I tell them that the attitudes of the wealthy toward (lower class) criminals are no more aggressive than those of the poor. According to the GSS, 75% of individuals making $110K or more favor the death penalty, but practically the same number of people making under $15K feel the same way (73%).

Monday, October 09, 2006

Blacks do not oppose interracial marriage: In the current issue of "American Renaissance," Jared Taylor writes that a feeling against marriage with whites is common among blacks. What may be true of vocal black nationalists may not be true among Jamal-Six-Pack. According to the GSS, less than 10% of blacks have favored a law against interracial marriage over the past 20 years. Now, black folks may be focused on not giving Jim Crow Cracker what he wants, but if their feeling was strong against miscegenation, they would agree with him on this one.

By the way, white attitudes on this question went from 39% in favor in 1972 all the way down to 10% in 2002.

Sunday, October 08, 2006

Eductional level is now a poor measure of intelligence: Pjgoober wondered if the correlation between IQ and education has declined over the past few decades, which might explain why the association between educational levels of spouses has evidently not been rising. Indeed, according to the GSS, the correlation has fallen sharply in the past 30 years from .59 to .39. The overall trend held for both whites and blacks. One's educational level is now a poor marker of intelligence.
Do men with higher status have more sex partners? Various theories predict this, but the data is what mattuh, so let's see what the GSS has to say....Strike one for these theories: 21% of men making under 50k had multiple sex partners last year, but only 13% of men making more than that did. I'm sure marriage and age accompany higher incomes, and these things do not help a man find girlfriends, but the theories are not supported nevertheless.

Saturday, October 07, 2006

They call them dreams because they never really happen: Let me share with you a dream that I had last night. It started with me at a party. I struck up a conversation with a woman who turned out to be a feminist. The discussion turned into a debate as I argued that men and women are fundamentally different. A crowd gathered, and she grew angry as the people responded to my common sense points and witty ripostes (this was my dream, remember). We were all laughing while she was scolding, and to mock her we began dancing the conga to the rhythm of her lecture: "Women-are-all-oppressed-see, duh-duh-duh-duh-duh-DUH." Then I said, "Darlin', I'll help you understand the concept of the ratio of the crackers to the liver pate-tio," and the crowd burst into laughter. Her face turned red, and I said, "See Honey, men are funnier too." The group's laughter woke me up, and I was so elated I couldn't go back to sleep.

Thursday, October 05, 2006

No trend toward assortative mating for education? Looking around in GSS data today, I discovered that there is no observable trend toward men marrying women of similar educational levels over the past 8o plus years. The correlation was around .6 from the 1920s (based on elderly people's answers given in the 1970s) through the 1970s, and came in at .55 by the 1990s, and there it remains. This puzzles me. I know the older the respondents, the higher the rate of attrition, but do individuals from educationally dissimilar marriages die at younger ages than their counterparts? And I based my 1970s correlations on young people, and the results were no different.

Monday, October 02, 2006

The Bell Curve has not convinced the American public


Since 1977, the General Social Survey has asked Americans if the lower economic status of blacks is due to inherited differences. The lower line on the graph above shows that the percent of whites who answer "yes" has gone from few to fewer. Twenty-six percent thought genes were the answer in 1977, and that number fell to only 10% by 1996. Following the publication of the Murray and Herrnstein's book, the genetic view rose slightly, peaking in 2000 at 12%, but by 2004 (the latest year available) it hit an all-time low of 7.7%. The popular assumption that race does not matter continues.

Are gun owners mentally ill?

  Some anti-gun people think owning a gun is a sign of some kind of mental abnormality. According to General Social Survey data, gun owners ...