Ordinary people accept nature and nurture: In 2004, the General Social Survey asked people if an athletic black man is explained more by genes or environment, and they were asked to give the answers percentages in 5% increments. The average white American answered 55% nurture. After years of seeing college students turned off by biosocial explanations, I was pleased by this number. I next looked at answers in terms of the respondent's IQ (based on a vocab test): the smartest group was a bit more nurturist than average at 60% environment. The dumbest group thought it was 95% genetic. High intelligence appears to move people in the wrong direction.
Next, I wanted to see how people felt about moral behavior. Respondents were asked about a Hispanic woman who is always good. I predicted that the average would be almost all environment. I was wrong: it was 55% nurturing--the same as the black athlete vignette. I was right, but only for the most intelligent group: they averaged 90% environment. The dullest group said 100% genes.
While it looks like education and taking the proper attitude to enhance one's status may shift a person in the nurturist direction, people in general seem to recognize that both genes and environment play a role in both physical and moral arenas. This gives me a little more faith that, while I'm surrounded by colleagues who make the world feel like a place of nutty radical nurturists, ordinary folks have some sense.
Friday, September 22, 2006
Does capitalism breed selfishness? I am constantly reading in social science literature that capitalism breeds selfishness. The Soviets might not have had a decent standard of living, but, hey, at least they cared about each other. The World Values Surveys asked people how willing were they to help various groups: poor people, the sick and disabled, neighbors, etc. I calculated an index of the average of their answers, the higher numbers indicating less willingness to help:
"Selfishness" Index
Belarus (2000) 18.33
Lithuania (1999) 14.69
Ukraine (1999) 14.61
Russian Federation (1999) 14.13
Estonia (1999) 13.32
Latvia (1999) 13.00
Great Britain (1999) 12.26
Hungary (1999) 12.21
Denmark (1999) 11.80
Germany West (1999) 11.72
France (1999) 11.72
Bulgaria (1999) 11.71
Finland (2000) 11.66
Czech Republic (1999) 11.65
Romania (1999) 11.53
Northern Ireland (1999) 11.44
Poland (1999) 11.39
Germany East (1999) 11.28
Austria (1999) 11.23
Luxembourg (1999) 11.13
Greece (1999) 11.12
Portugal (1999) 11.11
World 11.8
Netherlands (1999) 11.05
Belgium (1999) 10.95
Slovakia (1999) 10.91
Slovenia (1999) 10.89
Italy (1999) 10.81
Iceland (1999) 10.78
Malta (1999) 10.51
Croatia (1999) 10.33
Ireland (1999) 9.88
Sweden (1999) 9.62
Funny how all those years of communism didn't produce boatloads of humanitarians, and how capitalism hasn't turned everyone into devils. Oh, but I can anticipate you good sociologists out there. Americans weren't asked the question, and you're absolutely positive that the uniquely wicked American system would put us at the very top of this list. It's a good thing they weren't asked the question, so you can hold on to that cherished notion. (As if the data would change your mind anyway).
"Selfishness" Index
Belarus (2000) 18.33
Lithuania (1999) 14.69
Ukraine (1999) 14.61
Russian Federation (1999) 14.13
Estonia (1999) 13.32
Latvia (1999) 13.00
Great Britain (1999) 12.26
Hungary (1999) 12.21
Denmark (1999) 11.80
Germany West (1999) 11.72
France (1999) 11.72
Bulgaria (1999) 11.71
Finland (2000) 11.66
Czech Republic (1999) 11.65
Romania (1999) 11.53
Northern Ireland (1999) 11.44
Poland (1999) 11.39
Germany East (1999) 11.28
Austria (1999) 11.23
Luxembourg (1999) 11.13
Greece (1999) 11.12
Portugal (1999) 11.11
World 11.8
Netherlands (1999) 11.05
Belgium (1999) 10.95
Slovakia (1999) 10.91
Slovenia (1999) 10.89
Italy (1999) 10.81
Iceland (1999) 10.78
Malta (1999) 10.51
Croatia (1999) 10.33
Ireland (1999) 9.88
Sweden (1999) 9.62
Funny how all those years of communism didn't produce boatloads of humanitarians, and how capitalism hasn't turned everyone into devils. Oh, but I can anticipate you good sociologists out there. Americans weren't asked the question, and you're absolutely positive that the uniquely wicked American system would put us at the very top of this list. It's a good thing they weren't asked the question, so you can hold on to that cherished notion. (As if the data would change your mind anyway).
The "free" in freerepublic.com means "you're free to say what we tell you to say": I occasionally post my politically relevant comments on freerepublic.com. This recent post got me banned from the website for being a "racist":
The ghetto ain't the only reason for black violence: Steven Pinker, usually a reliable source, tells us in The Blank Slate that blacks who live in the suburbs are no more violent than their white counterparts. Uh, yes they are Steven. According to the 2004 Uniform Crime Reports, 36% of murderers arrested in American suburbs were black, and African Americans are not even close to 36% of all suburbanites. Political correctness infects even our best social scientists.
Horror of horrors, I blasphemed by uttering--can you feel your heart beating fast--a statistic. At least I know what I'm getting with liberals. Conservatives just masquerade as tough-minded people, and frankly it's disgusting.
The ghetto ain't the only reason for black violence: Steven Pinker, usually a reliable source, tells us in The Blank Slate that blacks who live in the suburbs are no more violent than their white counterparts. Uh, yes they are Steven. According to the 2004 Uniform Crime Reports, 36% of murderers arrested in American suburbs were black, and African Americans are not even close to 36% of all suburbanites. Political correctness infects even our best social scientists.
Horror of horrors, I blasphemed by uttering--can you feel your heart beating fast--a statistic. At least I know what I'm getting with liberals. Conservatives just masquerade as tough-minded people, and frankly it's disgusting.
Thursday, September 21, 2006
Does bad science in the name of sensitivity never end??? From CNN's website: "All Americans between the ages of 13 and 64 should be routinely tested for HIV to help catch infections earlier and stop the spread of the deadly virus, federal health officials recommended Thursday. The U.S. Centers for Disease Control and Prevention said HIV testing should become about as common as a cholesterol check. Nearly half of new HIV infections are discovered when doctors are trying to diagnose illness in a sick patient who has come for care, CDC officials said."
Yes, the best science shows us that the absolute strongest predictor of HIV infection is not being a child or a senior citizen. Future generations will laugh at us (or cry) for the ridiculous efforts we made to (unsuccessfully) convince people that AIDs has nothing to do with homosexuality; that street crime has nothing to do with race; and that terrorism has nothing to do with the Muslim religion.
Yes, the best science shows us that the absolute strongest predictor of HIV infection is not being a child or a senior citizen. Future generations will laugh at us (or cry) for the ridiculous efforts we made to (unsuccessfully) convince people that AIDs has nothing to do with homosexuality; that street crime has nothing to do with race; and that terrorism has nothing to do with the Muslim religion.
Tuesday, September 19, 2006
Smart countries have less homicide
.jpg)
.1.jpg)
Using Richard Lynn's data on national IQ and WHO data on male homicide victimization, I calculated a correlation of -.46 across 30 countries. The scatterplot is shown above. Argentina, Uruguay, and especially the United States are well above the regression line. Black Americans might raise homicide levels more than they lower average IQ, but murder rates among white Americans are higher than expected. This has been attributed to any number of things: frontier cultures that became violent due to a non-existent or ineffective criminal justice system (i.e., the Scots-Irish and the Wild West); immigration selecting for restlessness; and handy guns, which embolden criminals and turn a fight into a murder.
Saturday, September 16, 2006
The ghetto ain't the only reason for black violence: Steven Pinker, usually a reliable source, tells us in The Blank Slate that blacks who live in the suburbs are no more violent than their white counterparts. Uh, yes they are Steven. According to the 2004 Uniform Crime Reports, 36% of murderers arrested in American suburbs were black, and African Americans are not even close to 36% of all suburbanites. Political correctness infects even our best social scientists.
Thursday, September 14, 2006
Moral relativism spreads with economic development: The World Values Survey asked respondents if prostitution is justifiable. Answers ranged from 1 (never) to 10 (always). Here are the mean scores ranked from most to least accepting:
Switzerland 5.3
Spain 4.7
New Zealand 4.4
West Germany 4.3
Austria 4.1
Uruguay 3.8
East Germany 3.6
Canada 3.4
Argentina 3.4
Israel 3.4
Luxembourg 3.4
Great Britain 3.4
Slovenia 3.3
Philippines 3.2
Finland 3.2
Mexico 3.1
Chile 3.1
Greece 3.1
USA 3.1
Belarus 3.0
Iceland 2.8
Czech Republic 2.8
Dominican Republic 2.7
India 2.7
South Africa 2.6
Moldova 2.6
Ireland 2.5
Italy 2.4
Singapore 2.4
Lithuania 2.4
World 2.3
Russia 2.3
Colombia 2.3
Brazil 2.3
Romania 2.2
Japan 2.2
Korea 2.2
Venezuela 2.2
Northern Ireland 2.1
Peru 2.1
Ukraine 2.1
Kyrgyzstan 2.0
Croatia 2.0
Taiwan 2.0
Armenia 2.0
Uganda 1.8
El Salvador 1.8
Georgia 1.8
Serbia 1.8
Bosnia 1.7
Montenegro 1.7
Macedonia 1.6
Azerbaijan 1.6
Nigeria 1.6
Albania 1.4
Algeria 1.3
Saudi 1.3
Tanzania 1.2
Bangladesh 1.2
Iran 1.2
Vietnam 1.2
Egypt 1.1
Pakistan 1.1
China 1.1
Indonesia 1.1
Jordan 1.0
A clear pattern emerges here. Western countries lead the world in accepting prostitution. By contrast, Muslim countries uniformly condemn it. A difference in values couldn't be clearer. Other regions of the world fall somewhere in the middle. In less developed societies, especially the Muslim societies, people look to tradition to form their moral attitudes, while wealthy countries have moved toward a contract morality where any behavior, even renting a girl like you do a pay toilet, is okay if it is agreed to by both parties.
Switzerland 5.3
Spain 4.7
New Zealand 4.4
West Germany 4.3
Austria 4.1
Uruguay 3.8
East Germany 3.6
Canada 3.4
Argentina 3.4
Israel 3.4
Luxembourg 3.4
Great Britain 3.4
Slovenia 3.3
Philippines 3.2
Finland 3.2
Mexico 3.1
Chile 3.1
Greece 3.1
USA 3.1
Belarus 3.0
Iceland 2.8
Czech Republic 2.8
Dominican Republic 2.7
India 2.7
South Africa 2.6
Moldova 2.6
Ireland 2.5
Italy 2.4
Singapore 2.4
Lithuania 2.4
World 2.3
Russia 2.3
Colombia 2.3
Brazil 2.3
Romania 2.2
Japan 2.2
Korea 2.2
Venezuela 2.2
Northern Ireland 2.1
Peru 2.1
Ukraine 2.1
Kyrgyzstan 2.0
Croatia 2.0
Taiwan 2.0
Armenia 2.0
Uganda 1.8
El Salvador 1.8
Georgia 1.8
Serbia 1.8
Bosnia 1.7
Montenegro 1.7
Macedonia 1.6
Azerbaijan 1.6
Nigeria 1.6
Albania 1.4
Algeria 1.3
Saudi 1.3
Tanzania 1.2
Bangladesh 1.2
Iran 1.2
Vietnam 1.2
Egypt 1.1
Pakistan 1.1
China 1.1
Indonesia 1.1
Jordan 1.0
A clear pattern emerges here. Western countries lead the world in accepting prostitution. By contrast, Muslim countries uniformly condemn it. A difference in values couldn't be clearer. Other regions of the world fall somewhere in the middle. In less developed societies, especially the Muslim societies, people look to tradition to form their moral attitudes, while wealthy countries have moved toward a contract morality where any behavior, even renting a girl like you do a pay toilet, is okay if it is agreed to by both parties.
Tuesday, September 12, 2006
Does all the world want democracy? We hear it a lot these days about how democratic political systems are desired by all people, everywhere. But this blogger cares not for platitudes, but only for systematically observed attitudes. The World Values Surveys asked people all around the world if they think that this form of government is a good idea. Here's what I found:
Percent saying democratic political systems are a bad idea:
Russia 37.0
Kyrgyzstan 18.5
Philippines 17.6
Poland 16.3
Slovakia 15.9
Ukraine 15.4
South Korea 15.4
Chile 15.2
Brazil 15.1
Armenia 15.0
El Salvador 14.6
Iran 14.4
Lithuania 13.9
Bulgaria 13.6
Estonia 13.3
Latvia 12.7
Finland 12.6
Hungary 12.9
Australia 12.6
Great Britain 12.3
Colombia 12.0
Pakistan 11.9
Canada 11.6
Belarus 11.5
Romania 11.3
USA 10.8
Belgium 10.7
Slovenia 10.6
France 10.6
South Africa 10.2
Ireland 9.9
Argentina 9.4
Georgia 9.4
World 9.2
Iraq 9.0
Portugal 8.8
Macedonia 8.7
Puerto Rico 8.3
Japan 8.2
Turkey 8.1
Luxembourg 8.1
Northern Ireland 8.1
Bosnia 8.0
East Germany 7.7
Czech Republic 7.5
Algeria 7.3
Uganda 7.0
Peru 7.0
India 7.0
Switzerland 6.8
Tanzania 6.8
Taiwan 6.8
Venezuela 6.5
Malta 6.4
Singapore 6.2
Jordan 6.1
Serbia 5.9
Montenegro 5.5
Nigeria 4.7
Spain 4.7
West Germany 4.5
Vietnam 4.5
Morocco 4.4
Indonesia 4.1
Uruguay 3.9
Austria 3.8
China 3.7
Netherlands 3.6
Italy 3.4
Sweden 2.6
Azerbaijan 2.5
Albania 2.4
Croatia 2.3
Iceland 2.1
Denmark 2.0
Bangalesh 1.7
Egypt 1.4
Greece 1.1
First, affection for democracy is widespread around the world. No country has even close to a majority of people taking a position against it. Having said that, Russia is far and away the most anti-democratic country, and Eastern European and former Soviet countries in general are toward the top of the list. Contrary to what some people might expect, Muslims like democracy as much as anyone. Of course, being in favor a democratic political system does not mean that people are good at voting for candidates likely to preserve it. Asian, African, and Latin regions of the world are mixed. Western nations generally fall toward the bottom of the list, but English-speaking countries are on the high end of this group.
Percent saying democratic political systems are a bad idea:
Russia 37.0
Kyrgyzstan 18.5
Philippines 17.6
Poland 16.3
Slovakia 15.9
Ukraine 15.4
South Korea 15.4
Chile 15.2
Brazil 15.1
Armenia 15.0
El Salvador 14.6
Iran 14.4
Lithuania 13.9
Bulgaria 13.6
Estonia 13.3
Latvia 12.7
Finland 12.6
Hungary 12.9
Australia 12.6
Great Britain 12.3
Colombia 12.0
Pakistan 11.9
Canada 11.6
Belarus 11.5
Romania 11.3
USA 10.8
Belgium 10.7
Slovenia 10.6
France 10.6
South Africa 10.2
Ireland 9.9
Argentina 9.4
Georgia 9.4
World 9.2
Iraq 9.0
Portugal 8.8
Macedonia 8.7
Puerto Rico 8.3
Japan 8.2
Turkey 8.1
Luxembourg 8.1
Northern Ireland 8.1
Bosnia 8.0
East Germany 7.7
Czech Republic 7.5
Algeria 7.3
Uganda 7.0
Peru 7.0
India 7.0
Switzerland 6.8
Tanzania 6.8
Taiwan 6.8
Venezuela 6.5
Malta 6.4
Singapore 6.2
Jordan 6.1
Serbia 5.9
Montenegro 5.5
Nigeria 4.7
Spain 4.7
West Germany 4.5
Vietnam 4.5
Morocco 4.4
Indonesia 4.1
Uruguay 3.9
Austria 3.8
China 3.7
Netherlands 3.6
Italy 3.4
Sweden 2.6
Azerbaijan 2.5
Albania 2.4
Croatia 2.3
Iceland 2.1
Denmark 2.0
Bangalesh 1.7
Egypt 1.4
Greece 1.1
First, affection for democracy is widespread around the world. No country has even close to a majority of people taking a position against it. Having said that, Russia is far and away the most anti-democratic country, and Eastern European and former Soviet countries in general are toward the top of the list. Contrary to what some people might expect, Muslims like democracy as much as anyone. Of course, being in favor a democratic political system does not mean that people are good at voting for candidates likely to preserve it. Asian, African, and Latin regions of the world are mixed. Western nations generally fall toward the bottom of the list, but English-speaking countries are on the high end of this group.
Friday, September 08, 2006
Is the increase in autism due to delayed fatherhood? On September 5th, the LA Times described a study that found that fathers over 30 are much more at risk of having an autistic child than younger men. It is widely known that the prevalence of autism has been on the increase in recent years, but researchers don't know why. I looked at the General Social Survey and found evidence that the increase might be due, in part, to men waiting longer to become fathers. I looked at men ages 40-50, and in 1994, the mean age for first-time fatherhood was 25.8. By 2004, the average had risen to 27.2. This might not sound like much, but let's look at it another way. In 1994, 24% of men became fathers after age 29. In 2004, the percentage was 37. That is a 54% increase in only one decade in the number of men starting fatherhood later in life.
According to the team that conducted the study, the association between the father's older age and autism might be due to "spontaneous mutations in sperm-producing cells and alterations in genetic 'imprinting,' which controls the genes that are activated during development."
According to the team that conducted the study, the association between the father's older age and autism might be due to "spontaneous mutations in sperm-producing cells and alterations in genetic 'imprinting,' which controls the genes that are activated during development."
Having kids move blacks to the left: In an earlier post, I presented numbers from the General Social Survey (GSS) that squared with Steve Sailer's thesis that low housing prices facilitate family formation among whites which then turns them into political conservatives. So my next question is: what does a large family do to black parents? According to the GSS, lots of kids moves blacks to the left. Data on the 2000 presidential election (the most recent available to the public) reveals that blacks who voted for Gore had a mean of .75 children living at home with them, while Bush supporters averaged only .38. (The numbers are low compared to those in my analysis of whites because I included older parents here to maximize sample size).
Conservative values might explain why some blacks voted for Bush, but not why they have fewer kids. Having even one child seems to cause a shift: 14% of those with no kids voted Republican, but that drops to 7% for those with at least one. Whites are a middle-income group: perhaps concern for your children leads people to see big government as an obstacle, while black parents, as a low-income group that has turned to government for answers for decades, look even more to Democrats in order to help their children.
So Steve's thesis is a race-specific one that does not seem to apply to blacks. He also argues that whites, as a group, avoid having kids until they own a nice house--the kind that is safe and enjoyable for kids, in a good neighborhood. This attitude does not seem widespread among blacks, so Democrat strategists should not draw the lesson from this analysis that cheap housing in good neighborhoods will increase the number of blacks with children, thereby attracting more black supporters. (As if that were possible--the only thing harder to find than a black Republican is me, a conservative social scientist).
This analysis reminds me of something I have seen many, many times in research studies: findings are almost never the same for blacks and whites. Social scientists--the most politically correct people in the world--routinely analyze the two groups separately. They force black and white data points to live in different neighborhoods because they know that they are so distinct from each other that they must do it.
By the way, I also looked to see what factors other than number of kids might distinguish black Republicans from Democrats. I was surprised that the two groups do not differ much in terms of income, education, IQ, occupational prestige, or religiosity. The only thing I found was gender: men were almost two times as likely as women to vote for Bush.
Conservative values might explain why some blacks voted for Bush, but not why they have fewer kids. Having even one child seems to cause a shift: 14% of those with no kids voted Republican, but that drops to 7% for those with at least one. Whites are a middle-income group: perhaps concern for your children leads people to see big government as an obstacle, while black parents, as a low-income group that has turned to government for answers for decades, look even more to Democrats in order to help their children.
So Steve's thesis is a race-specific one that does not seem to apply to blacks. He also argues that whites, as a group, avoid having kids until they own a nice house--the kind that is safe and enjoyable for kids, in a good neighborhood. This attitude does not seem widespread among blacks, so Democrat strategists should not draw the lesson from this analysis that cheap housing in good neighborhoods will increase the number of blacks with children, thereby attracting more black supporters. (As if that were possible--the only thing harder to find than a black Republican is me, a conservative social scientist).
This analysis reminds me of something I have seen many, many times in research studies: findings are almost never the same for blacks and whites. Social scientists--the most politically correct people in the world--routinely analyze the two groups separately. They force black and white data points to live in different neighborhoods because they know that they are so distinct from each other that they must do it.
By the way, I also looked to see what factors other than number of kids might distinguish black Republicans from Democrats. I was surprised that the two groups do not differ much in terms of income, education, IQ, occupational prestige, or religiosity. The only thing I found was gender: men were almost two times as likely as women to vote for Bush.
Tuesday, September 05, 2006
Seventeen percent of the world is anti-Semitic: The World Values Survey asked people if there were certain kinds of people you wouldn't want as neighbors. The following proportions refer to Jews:
Iraq (2004) .83
Turkey (2001) .62
Republic of Korea (2001) .41
Serbian Republic of Bosnia (2001) .36
Spain (2000) .34
Poland (1999) .26
Republic of Moldova (2002) .25
Bosnia Federation (2001) .24
Romania (1999) .23
Uganda (2001) .23
Lithuania (1999) .22
Malta (1999) .21
Kyrgyzstan (2003) .20
Bangladesh (2002) .20
Macedonia, Republic of (2001) .20
South Africa (2001) .19
Greece (1999) .19
World .17
Zimbabwe (2001) .17
Bulgaria (1999) .17
Albania (2002) .17
Slovenia (1999) .17
Egypt (2000) .17
Croatia (1999) .16
Belarus (2000) .15
Italy (1999) .13
Northern Ireland (1999) .12
Russian Federation (1999) .11
Ireland (1999) .11
Estonia (1999) .11
Belgium (1999) .11
Portugal (1999) .11
Ukraine (1999) .10
Uruguay (1996) .10
Slovakia (1999) .10
Luxembourg (1999) .10
United States (1999) .09
Chile (2000) .09
Germany East (1999) .09
Austria (1999) .09
Finland (2000) .08
Argentina (1999) .06
Great Britain (1999) .06
France (1999) .06
Latvia (1999) .05
Germany West (1999) .05
Czech Republic (1999) .04
Iceland (1999) .04
Canada (2000) .04
Denmark (1999) .02
Sweden (1999) .02
Netherlands (1999) .02
According to this sample, 17% of the world is anti-Semitic. Not surprisingly, Muslim countries rank high--83% of Iraqis wouldn't want a Jewish neighbor. (But countries like Egypt are in the middle). Korea--the only East Asian country in the sample--ranks very high, as does Spain among European countries. Eastern Europe is mixed with higher numbers in the south. SS African countries fall towards the middle. South American nations have low numbers, as does Western Europe, especially in the north. English-speaking countries also fall toward the bottom.
Iraq (2004) .83
Turkey (2001) .62
Republic of Korea (2001) .41
Serbian Republic of Bosnia (2001) .36
Spain (2000) .34
Poland (1999) .26
Republic of Moldova (2002) .25
Bosnia Federation (2001) .24
Romania (1999) .23
Uganda (2001) .23
Lithuania (1999) .22
Malta (1999) .21
Kyrgyzstan (2003) .20
Bangladesh (2002) .20
Macedonia, Republic of (2001) .20
South Africa (2001) .19
Greece (1999) .19
World .17
Zimbabwe (2001) .17
Bulgaria (1999) .17
Albania (2002) .17
Slovenia (1999) .17
Egypt (2000) .17
Croatia (1999) .16
Belarus (2000) .15
Italy (1999) .13
Northern Ireland (1999) .12
Russian Federation (1999) .11
Ireland (1999) .11
Estonia (1999) .11
Belgium (1999) .11
Portugal (1999) .11
Ukraine (1999) .10
Uruguay (1996) .10
Slovakia (1999) .10
Luxembourg (1999) .10
United States (1999) .09
Chile (2000) .09
Germany East (1999) .09
Austria (1999) .09
Finland (2000) .08
Argentina (1999) .06
Great Britain (1999) .06
France (1999) .06
Latvia (1999) .05
Germany West (1999) .05
Czech Republic (1999) .04
Iceland (1999) .04
Canada (2000) .04
Denmark (1999) .02
Sweden (1999) .02
Netherlands (1999) .02
According to this sample, 17% of the world is anti-Semitic. Not surprisingly, Muslim countries rank high--83% of Iraqis wouldn't want a Jewish neighbor. (But countries like Egypt are in the middle). Korea--the only East Asian country in the sample--ranks very high, as does Spain among European countries. Eastern Europe is mixed with higher numbers in the south. SS African countries fall towards the middle. South American nations have low numbers, as does Western Europe, especially in the north. English-speaking countries also fall toward the bottom.
Monday, September 04, 2006
"Affordable Family Formation" and General Social Survey data
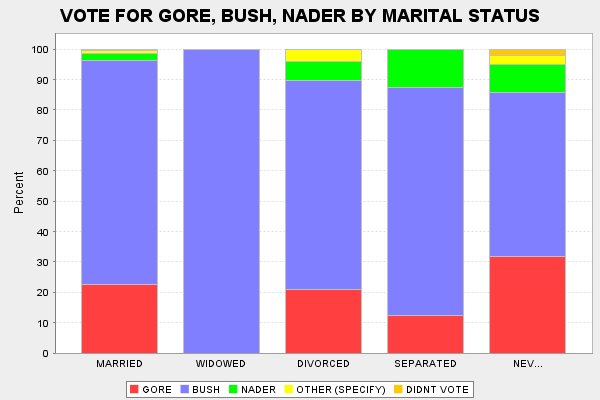


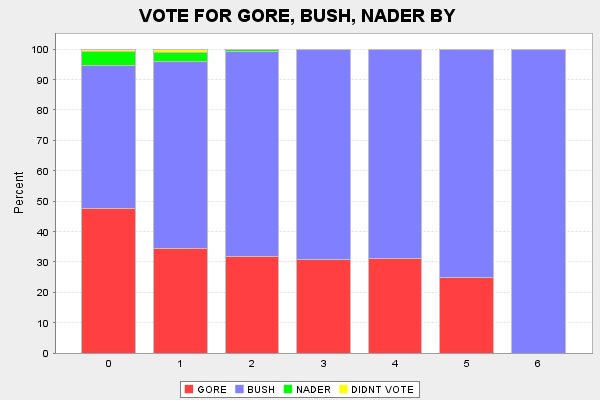
Steve Sailer wanted to know what General Social Survey (GSS) data say about his "affordable family formation" thesis that inexpensive housing allows young, white people to get married, have children, which then convinces them to vote Republican. Preliminary analysis showed that the pattern of voting Republican as family size grows is sharper among younger, white Americans, so the numbers shown here refer to people ages 18 to 45, as of 2004.
First, I looked at never married people, and the first graph shows that white, married men were more likely to vote for Bush than their never-married counterparts. This tendency is even stronger among women, as shown in the second graph--a majority of never-married women voted for Gore.
Now turning to the question of family size, the third graph shows that the percent of men voting for Bush in 2000 increases with the number of children they have: few men with large families voted for Gore. For women (graph 4), the big shift occurs between those with no kids, and those with one or more children. Almost one-half of white women with no children voted Democrat, but only about 30% did if they had any children.
Steve was also interested in the mean number of children at home for whites of different political orientations. Once again, patterns are sharper among younger whites who have kids living at home, so I focused on them:
Mean children at home for NH whites ages 18-45 (2004)
Extremely liberal .78
Liberal .59
Slightly liberal .64
Moderate .90
Slightly cons. .94
Conservative 1.20
Extremely cons. 1.02
It is clear that young, white conservatives have bigger families than their liberal counterparts. From these data, it is unclear what is driving what: family life may move people right, or conservatives might be more likely to choose marriage and large families. One line of evidence that supports Steve's idea is that these patterns seem to have emerged in the last decade. Among empty-nesters, white liberals have almost as many kids as conservatives. The large family/voting Republican correlation has grown in the last decade, perhaps fueled by trends in housing prices.
The GSS data are also consistent with the state-level data that Steve analyzed which show that red states have cheap housing prices and white families with lots of babies. That survey data would show the same pattern at the individual-level as data at a macro-level is significant.
More later....
Friday, September 01, 2006
In Denmark, you're supposed to have unconditional regard for all humanity...except for your mother, that is: The World Values Survey asked people if parents should always be loved and respected, or do they have to earn it. Here are the proportion in each country that said always:
Proportion saying parents should always be respected:
Viet Nam (2001) .99
Puerto Rico (2001) .97
Morocco (2001) .97
Zimbabwe (2001) .96
Egypt (2000) .95
China (2001) .94
Pakistan (2001) .94
Nigeria (2000) .94
Jordan (2001) .94
Venezuela (2000) .94
Singapore (2002) .94
Kyrgyzstan (2003) .94
Philippines (2001) .94
El Salvador (1999) .94
Taiwan Province of China (1994) .93
Algeria (2002) .93
Armenia (1997) .93
Serbian Republic of Bosnia (2001) .93
Brazil (1997) .93
Republic of Korea (2001) .92
Saudi Arabia (2003) .92
Malta (1999) .92
Azerbaijan (1997) .92
Georgia (1996) .91
Macedonia, Republic of (2001) .91
Colombia (1998) .91
Uganda (2001) .91
South Africa (2001) .91
Peru (2001) .91
Tanzania, United Republic Of (2001) .91
Republic of Moldova (2002) .91
Bosnia Federation (2001) .90
Indonesia (2001) .90
Mexico (2000) .90
Bangladesh (2002) .90
Iran (Islamic Republic of) (2000) .89
India (2001) .89
Argentina (1999) .88
Spain (2000) .88
Poland (1999) .87
Chile (2000) .87
Montenegro (2001) .87
Serbia (2001) .87
Albania (2002) .87
Ukraine (1999) .86
Dominican Republic (1996) .86
Turkey (2001) .85
Russian Federation (1999) .85
Portugal (1999) .84
Romania (1999) .84
Hungary (1999) .83
Lithuania (1999) .82
Bulgaria (1999) .80
Italy (1999) .79
Canada (2000) .79
Slovenia (1999) .78
Uruguay (1996) .77
United States (1999) .77
Northern Ireland (1999) .77
Latvia (1999) .77
France (1999) .75
Czech Republic (1999) .74
Australia (1995) .74
Slovakia (1999) .73
Estonia (1999) .72
Japan (2000) .72
Switzerland (1996) .71
Ireland (1999) .71
Belarus (2000) .71
Germany East (1999) .70
Greece (1999) .69
Belgium (1999) .67
Austria (1999) .65
Great Britain (1999) .65
New Zealand (1998) .64
Croatia (1999) .63
Finland (2000) .62
Iceland (1999) .61
Luxembourg (1999) .59
Norway (1996) .52
Germany West (1999) .51
Sweden (1999) .43
Netherlands (1999) .32
Denmark (1999) .28
It looks like the less developed world still feels unconditional regard for mom and dad, but Eastern Europe shows a noticeable share of people who feel differently. It's a bit more mixed in wealthy countries, and the clearest pattern here is that many northern Europeans feel no obligation to love their parents. It seems that individualism and modernization breaks down the traditional loyalty to family. In Denmark, you're supposed to have unconditional regard for all humanity...except for your mother, that is.
Proportion saying parents should always be respected:
Viet Nam (2001) .99
Puerto Rico (2001) .97
Morocco (2001) .97
Zimbabwe (2001) .96
Egypt (2000) .95
China (2001) .94
Pakistan (2001) .94
Nigeria (2000) .94
Jordan (2001) .94
Venezuela (2000) .94
Singapore (2002) .94
Kyrgyzstan (2003) .94
Philippines (2001) .94
El Salvador (1999) .94
Taiwan Province of China (1994) .93
Algeria (2002) .93
Armenia (1997) .93
Serbian Republic of Bosnia (2001) .93
Brazil (1997) .93
Republic of Korea (2001) .92
Saudi Arabia (2003) .92
Malta (1999) .92
Azerbaijan (1997) .92
Georgia (1996) .91
Macedonia, Republic of (2001) .91
Colombia (1998) .91
Uganda (2001) .91
South Africa (2001) .91
Peru (2001) .91
Tanzania, United Republic Of (2001) .91
Republic of Moldova (2002) .91
Bosnia Federation (2001) .90
Indonesia (2001) .90
Mexico (2000) .90
Bangladesh (2002) .90
Iran (Islamic Republic of) (2000) .89
India (2001) .89
Argentina (1999) .88
Spain (2000) .88
Poland (1999) .87
Chile (2000) .87
Montenegro (2001) .87
Serbia (2001) .87
Albania (2002) .87
Ukraine (1999) .86
Dominican Republic (1996) .86
Turkey (2001) .85
Russian Federation (1999) .85
Portugal (1999) .84
Romania (1999) .84
Hungary (1999) .83
Lithuania (1999) .82
Bulgaria (1999) .80
Italy (1999) .79
Canada (2000) .79
Slovenia (1999) .78
Uruguay (1996) .77
United States (1999) .77
Northern Ireland (1999) .77
Latvia (1999) .77
France (1999) .75
Czech Republic (1999) .74
Australia (1995) .74
Slovakia (1999) .73
Estonia (1999) .72
Japan (2000) .72
Switzerland (1996) .71
Ireland (1999) .71
Belarus (2000) .71
Germany East (1999) .70
Greece (1999) .69
Belgium (1999) .67
Austria (1999) .65
Great Britain (1999) .65
New Zealand (1998) .64
Croatia (1999) .63
Finland (2000) .62
Iceland (1999) .61
Luxembourg (1999) .59
Norway (1996) .52
Germany West (1999) .51
Sweden (1999) .43
Netherlands (1999) .32
Denmark (1999) .28
It looks like the less developed world still feels unconditional regard for mom and dad, but Eastern Europe shows a noticeable share of people who feel differently. It's a bit more mixed in wealthy countries, and the clearest pattern here is that many northern Europeans feel no obligation to love their parents. It seems that individualism and modernization breaks down the traditional loyalty to family. In Denmark, you're supposed to have unconditional regard for all humanity...except for your mother, that is.
Thursday, August 31, 2006
Godless countries favor abortion: My international dataset is growing, so I hope to find some interesting patterns (at least interesting for nerds of my variety). I looked at the World Values Survey to see which countries are most pro-abortion, and this is the proportion of people who approve of an abortion if a woman does not want more children. (This variable correlates with favoring an abortion because mom is not married at .88, so results with either would be similar).
Proportion approving of an abortion because no more kids are wanted:
Sweden (1999) .86
Bulgaria (1999) .82
Germany East (1999) .77
Hungary (1999) .76
Czech Republic (1999) .76
Slovenia (1999) .75
Russian Federation (1999) .74
Denmark (1999) .72
Estonia (1999) .71
Belarus (2000) .68
Lithuania (1999) .65
Latvia (1999) .64
Ukraine (1999) .63
France (1999) .62
Croatia (1999) .60
Romania (1999) .57
Greece (1999) .55
Finland (2000) .54
Slovakia (1999) .52
Iceland (1999) .50
Netherlands (1999) .49
Germany West (1999) .49
Great Britain (1999) .49
Austria (1999) .45
Belgium (1999) .42
Turkey (2001) .41
Portugal (1999) .40
Poland (1999) .37
Luxembourg (1999) .36
Italy (1999) .31
Northern Ireland (1999) .18
Malta (1999) .16
Ireland (1999) .13
The pattern is very clear here: Protestant and Orthodox countries (which, in actuality, are likely to be irreligious) generally approve of abortion more than Catholic countries. (Hungary is an exception). This is no surprise, but Orthodoxy has the same basic view of abortion that Catholicism has. It clearly has less influence over the values of its adherents. I imagine the Soviets teaching children in school not to believe in God (or was that Dover MA where that happened?) might have something to do with that.
Across 33 countries, I calculated the correlation between the percent not believing in God and the share of people who favor abortion to control family size. It is .68: there is a strong connection here. I never liked abortion even when I was an atheist, but evidently as soon as God goes out, it's bring in the abortionist.
Proportion approving of an abortion because no more kids are wanted:
Sweden (1999) .86
Bulgaria (1999) .82
Germany East (1999) .77
Hungary (1999) .76
Czech Republic (1999) .76
Slovenia (1999) .75
Russian Federation (1999) .74
Denmark (1999) .72
Estonia (1999) .71
Belarus (2000) .68
Lithuania (1999) .65
Latvia (1999) .64
Ukraine (1999) .63
France (1999) .62
Croatia (1999) .60
Romania (1999) .57
Greece (1999) .55
Finland (2000) .54
Slovakia (1999) .52
Iceland (1999) .50
Netherlands (1999) .49
Germany West (1999) .49
Great Britain (1999) .49
Austria (1999) .45
Belgium (1999) .42
Turkey (2001) .41
Portugal (1999) .40
Poland (1999) .37
Luxembourg (1999) .36
Italy (1999) .31
Northern Ireland (1999) .18
Malta (1999) .16
Ireland (1999) .13
The pattern is very clear here: Protestant and Orthodox countries (which, in actuality, are likely to be irreligious) generally approve of abortion more than Catholic countries. (Hungary is an exception). This is no surprise, but Orthodoxy has the same basic view of abortion that Catholicism has. It clearly has less influence over the values of its adherents. I imagine the Soviets teaching children in school not to believe in God (or was that Dover MA where that happened?) might have something to do with that.
Across 33 countries, I calculated the correlation between the percent not believing in God and the share of people who favor abortion to control family size. It is .68: there is a strong connection here. I never liked abortion even when I was an atheist, but evidently as soon as God goes out, it's bring in the abortionist.
Wednesday, August 30, 2006
The religious shall inherit the earth: I wanted to quantify the pattern of religious people having more children than the irreligious. Starting with the U.S, the General Social Survey (2004) indicates that Americans who never go to church average 1.67 kids: it's 2.25 for those who go weekly and a slightly lower 2.14 for those who go more often. By the way, the fertile "attends weekly" group is not fringe: it is the modal category of religious behavior in America.
As for the world, I looked at the World Values Survey and calculated that those who never attend religious services have 1.72 children, compared to 2.47 for those going more than once a week. (I suspect that this sample is a bit skewed toward more developed countries).
I'm reminded of William James' statement that (went something like) believers will always have more vitality than non-believers.
As for the world, I looked at the World Values Survey and calculated that those who never attend religious services have 1.72 children, compared to 2.47 for those going more than once a week. (I suspect that this sample is a bit skewed toward more developed countries).
I'm reminded of William James' statement that (went something like) believers will always have more vitality than non-believers.
Saturday, August 26, 2006
The Democrat party is not the party of the little man: When Democrats say they are the party of the little man, they mean they are the party of the black man (even if he is rich--18% of blacks make more than I do). The General Social Survey reveals that 53% of poor whites (individuals making less than $17,500/year) voted for Bush in 2000 (2004 data are not available). And Democrats are wrong to paint Republicans as the party of fat cats: 62% of whites in the richest category ($110,000+/year) voted for Bush, but that is practically the same share as for whites of all incomes--59%. Sixty percent of the whites who voted Republican make less than $50,000 annually.
Thursday, August 24, 2006
Atheism rises with economic development and average IQ: The World Values Survey asked respondents whether or not they believed in God. I was suprised how national results ranged from most people to nobody being atheists:
Percent who do not believe in God:
Vietnamese 81.2
East Germany 69.7
Czech Republic 61.1
Estonia 48.6
Sweden 46.6
Japan 42.6
France 38.5
Slovenia 34.8
Bulgaria 33.8
Hungary 31.9
Denmark 31.1
Russia 29.7
Belgium 29.0
Great Britain 28.1
Luxembourg 26.8
West Germany 23.1
New Zealand 20.8
Latvia 20.5
Australia 19.9
Ukraine 19.7
Serbia 17.6
Finland 17.5
Slovakia 17.2
Belarus 17.1
Montenegro 17.0
Iceland 15.6
Armenia 14.4
Lithuania 13.5
Spain 17.1
Uruguay 13.3
Austria 13.2
Singapore 12.9
World 12.4
Bosnia and Herzegovina 12.0
Canada 10.7
Macedonia 9.5
Greece 9.1
Albania 8.3
Northern Ireland 6.8
Georgia 6.8
Croatia 6.8
Italy 6.5
India 5.3
Kyrgyzstan 5.0
USA 4.4
Ireland 4.3
Moldova 4.0
Romania 3.7
Argentina 3.7
Portugal 3.1
Chile 3.0
Poland 2.7
Turkey 2.2
Azerbaijan 2.2
Mexico 2.0
Peru 1.5
South Africa 1.2
Brazil 0.9
Colombia 0.9
Portugal 3.1
Puerto Rico 0.8
Tanzania 0.7
El Salvador 0.6
Iran 0.6
Uganda 0.6
Philippines 0.6
Bangladesh 0.5
Malta 0.5
Nigeria 0.3
Algeria 0.2
Jordan 0.2
Saudi Arabia 0.1
Indonesia 0.1
Morocco 0.0
Pakistan 0.0
Egypt 0.0
It does not please me to write that smarter countries are more atheistic because I consider myself a believer (probably "hoper" is the more correct term) but thems the facts. Europe and Asia are the most skeptical regions, and they are also the most intelligent. There are several smart, believing countries, however (smart=95+ means): Singapore (103), Italy (102), Poland (99), USA (98), Canada (97), Argentina (96), and Portugal (95). From what I can see, there isn't a single atheistic country that is stupid. Unintelligent countries are uniformly believers. And it appears that the religious atmosphere in many Muslim countries snuff out any atheism whatsoever (at least you can't find people willing to admit that they are non-believers.)
Percent who do not believe in God:
Vietnamese 81.2
East Germany 69.7
Czech Republic 61.1
Estonia 48.6
Sweden 46.6
Japan 42.6
France 38.5
Slovenia 34.8
Bulgaria 33.8
Hungary 31.9
Denmark 31.1
Russia 29.7
Belgium 29.0
Great Britain 28.1
Luxembourg 26.8
West Germany 23.1
New Zealand 20.8
Latvia 20.5
Australia 19.9
Ukraine 19.7
Serbia 17.6
Finland 17.5
Slovakia 17.2
Belarus 17.1
Montenegro 17.0
Iceland 15.6
Armenia 14.4
Lithuania 13.5
Spain 17.1
Uruguay 13.3
Austria 13.2
Singapore 12.9
World 12.4
Bosnia and Herzegovina 12.0
Canada 10.7
Macedonia 9.5
Greece 9.1
Albania 8.3
Northern Ireland 6.8
Georgia 6.8
Croatia 6.8
Italy 6.5
India 5.3
Kyrgyzstan 5.0
USA 4.4
Ireland 4.3
Moldova 4.0
Romania 3.7
Argentina 3.7
Portugal 3.1
Chile 3.0
Poland 2.7
Turkey 2.2
Azerbaijan 2.2
Mexico 2.0
Peru 1.5
South Africa 1.2
Brazil 0.9
Colombia 0.9
Portugal 3.1
Puerto Rico 0.8
Tanzania 0.7
El Salvador 0.6
Iran 0.6
Uganda 0.6
Philippines 0.6
Bangladesh 0.5
Malta 0.5
Nigeria 0.3
Algeria 0.2
Jordan 0.2
Saudi Arabia 0.1
Indonesia 0.1
Morocco 0.0
Pakistan 0.0
Egypt 0.0
It does not please me to write that smarter countries are more atheistic because I consider myself a believer (probably "hoper" is the more correct term) but thems the facts. Europe and Asia are the most skeptical regions, and they are also the most intelligent. There are several smart, believing countries, however (smart=95+ means): Singapore (103), Italy (102), Poland (99), USA (98), Canada (97), Argentina (96), and Portugal (95). From what I can see, there isn't a single atheistic country that is stupid. Unintelligent countries are uniformly believers. And it appears that the religious atmosphere in many Muslim countries snuff out any atheism whatsoever (at least you can't find people willing to admit that they are non-believers.)
Wednesday, August 23, 2006
Puerto Ricans are the proudest people in the world. Can't imagine why. Must be the beaches: Participants in the World Values Survey were asked if they are proud of their nationality. The following percent answered "very proud":
Percent saying they are very proud of their nationality
Puerto Rico 95.6
Iran 92.2
Venezuela 92.1
Philippines 87.5
El Salvador 86.6
Morocco 85.9
Colombia 85.0
Portugal 82.4
Egypt 81.9
Tanzania 81.6
Pakistan 81.5
Mexico 79.5
Dominican Republic 78.6
Iraq 77.6
Peru 76.8
USA 76.1
Australia 76.0
South Africa 75.2
Malta 74.8
Saudi Arabia 74.6
Chile 74.0
Albania 73.6
Vietnam 73.4
Ireland 73.3
Bangladesh 73.1
Poland 72.2
Nigeria 72.0
India 70.2
Argentina 69.4
Jordan 68.2
New Zealand 68.0
Canada 67.6
Iceland 67.0
Georgia 65.2
Uganda 66.2
Brazil 66.0
Spain 64.4
Slovenia 59.0
Macedonia 58.1
Finland 58.3
Greece 56.0
Turkey 55.5
Hungary 54.9
Israel 54.4
Austria 53.9
Luxembourg 53.2
Great Britain 50.9
Denmark 49.7
Romania 47.3
Kyrgyzstan 46.7
Armenia 45.9
Singapore 45.3
France 44.7
Sweden 43.7
Italy 42.2
Croatia 43.6
Serbia 41.6
Latvia 40.4
Bosnia and Herzegovina 39.0
China 37.9
Bulgaria 36.6
Russia 34.9
East Germany 34.1
Montenegro 33.0
Japan 32.5
Belarus 31.7
Northern Ireland 30.5
Czech Republic 30.0
Ukraine 28.7
Slovakia 26.5
Belgium 25.4
Estonia 24.5
Lithuania 24.4
Netherlands 24.3
Moldova 23.4
Korea 20.8
West Germany 14.4
From what I can see, the proudest people often have the least reason to be so. Logically, you would expect people to think a lot of their country if it has contributed a lot, if it has been comparatively moral, or at least dominant. Evidently, the opposite is to be true. Latin, Muslim, and African countries are the proudest, and let's face it, are unexceptional. West Germany's ranking at the bottom makes sense I suppose, but don't Bach, Beethoven, Brahms, Handel, Schumann, Strauss, and Wagner compesnsate a little (just to name composers)? And why do the Dutch feel so bad about themselves? Have they forgotten Rembrandt, Vermeer, van Gogh, Escher, just to list the painters?!
Pride might indicate an underlying sense of inferiority, while a lack of pride is seen in an achievement-oriented people who don't want to get cocky (or at least don't want to express a proud attitude). At an individual level, accomplished people are often hardest on themselves, and one's feeling about his nation might be tied to his feelings about himself.
Percent saying they are very proud of their nationality
Puerto Rico 95.6
Iran 92.2
Venezuela 92.1
Philippines 87.5
El Salvador 86.6
Morocco 85.9
Colombia 85.0
Portugal 82.4
Egypt 81.9
Tanzania 81.6
Pakistan 81.5
Mexico 79.5
Dominican Republic 78.6
Iraq 77.6
Peru 76.8
USA 76.1
Australia 76.0
South Africa 75.2
Malta 74.8
Saudi Arabia 74.6
Chile 74.0
Albania 73.6
Vietnam 73.4
Ireland 73.3
Bangladesh 73.1
Poland 72.2
Nigeria 72.0
India 70.2
Argentina 69.4
Jordan 68.2
New Zealand 68.0
Canada 67.6
Iceland 67.0
Georgia 65.2
Uganda 66.2
Brazil 66.0
Spain 64.4
Slovenia 59.0
Macedonia 58.1
Finland 58.3
Greece 56.0
Turkey 55.5
Hungary 54.9
Israel 54.4
Austria 53.9
Luxembourg 53.2
Great Britain 50.9
Denmark 49.7
Romania 47.3
Kyrgyzstan 46.7
Armenia 45.9
Singapore 45.3
France 44.7
Sweden 43.7
Italy 42.2
Croatia 43.6
Serbia 41.6
Latvia 40.4
Bosnia and Herzegovina 39.0
China 37.9
Bulgaria 36.6
Russia 34.9
East Germany 34.1
Montenegro 33.0
Japan 32.5
Belarus 31.7
Northern Ireland 30.5
Czech Republic 30.0
Ukraine 28.7
Slovakia 26.5
Belgium 25.4
Estonia 24.5
Lithuania 24.4
Netherlands 24.3
Moldova 23.4
Korea 20.8
West Germany 14.4
From what I can see, the proudest people often have the least reason to be so. Logically, you would expect people to think a lot of their country if it has contributed a lot, if it has been comparatively moral, or at least dominant. Evidently, the opposite is to be true. Latin, Muslim, and African countries are the proudest, and let's face it, are unexceptional. West Germany's ranking at the bottom makes sense I suppose, but don't Bach, Beethoven, Brahms, Handel, Schumann, Strauss, and Wagner compesnsate a little (just to name composers)? And why do the Dutch feel so bad about themselves? Have they forgotten Rembrandt, Vermeer, van Gogh, Escher, just to list the painters?!
Pride might indicate an underlying sense of inferiority, while a lack of pride is seen in an achievement-oriented people who don't want to get cocky (or at least don't want to express a proud attitude). At an individual level, accomplished people are often hardest on themselves, and one's feeling about his nation might be tied to his feelings about himself.
Tuesday, August 22, 2006
Believe it or not, among wealthy countries America is the most altruistic: The World Values Survey asked people how important it was to them to serve others. The following is the percent who answered "very important":
Percent saying serving others is very important to them:
Puerto Rico 78.8
Morocco 67.8
Venezuela 67.7
Jordan 67.0
Mexico 63.6
Iran 62.1
Nigeria 62.0
Egypt 61.8
Tanzania 58.6
Philippines 57.5
Argentina 56.6
Chile 53.4
USA 51.2
Peru 49.4
South Africa 49.2
Uganda 47.9
Bangladesh 46.8
India 46.6
Canada 42.4
Saudi Arabia 40.8
Serbia 37.9
Sweden 37.3
Indonesia 36.5
Pakistan 33.2
Moldova 32.2
Spain 30.2
Kyrgyzstan 25.4
Albanian 19.9
Bosnia and Herzegovina 17.6
Vietnam 16.2
Singapore 15.9
China 15.6
Macedonia 14.5
Montenegro 13.3
Korea 10.8
Japan 8.6
The regional pattern: East Asia and SE Europe, low; Latin America, Muslim, and African, high; and developed countries, moderate. It's interesting that an altruistic spirit has little to do with how well a country actually serves the needs of its people. The service-oriented nations in the list generally do a poor job. In fact, Japan and Korea--the last two on the list--have produced successful societies without a strong feeling of duty to others. Western countries have created high levels of well-being with only very moderate amounts of altruism.
And while the United States has the reputation of a gang of heartless capitalists, it ranks as the most service-minded country among developed nations.
I can examine this more systematically when I have finished building a data set, but these patterns might reflect the religious culture of the people. The Catholic Church may have taught Puerto Ricans to believe in the importance of serving others, even if they don't always do it. On the other hand, Japanese people might be good neighbors, even though they don't have the same kind of religious culture.
Percent saying serving others is very important to them:
Puerto Rico 78.8
Morocco 67.8
Venezuela 67.7
Jordan 67.0
Mexico 63.6
Iran 62.1
Nigeria 62.0
Egypt 61.8
Tanzania 58.6
Philippines 57.5
Argentina 56.6
Chile 53.4
USA 51.2
Peru 49.4
South Africa 49.2
Uganda 47.9
Bangladesh 46.8
India 46.6
Canada 42.4
Saudi Arabia 40.8
Serbia 37.9
Sweden 37.3
Indonesia 36.5
Pakistan 33.2
Moldova 32.2
Spain 30.2
Kyrgyzstan 25.4
Albanian 19.9
Bosnia and Herzegovina 17.6
Vietnam 16.2
Singapore 15.9
China 15.6
Macedonia 14.5
Montenegro 13.3
Korea 10.8
Japan 8.6
The regional pattern: East Asia and SE Europe, low; Latin America, Muslim, and African, high; and developed countries, moderate. It's interesting that an altruistic spirit has little to do with how well a country actually serves the needs of its people. The service-oriented nations in the list generally do a poor job. In fact, Japan and Korea--the last two on the list--have produced successful societies without a strong feeling of duty to others. Western countries have created high levels of well-being with only very moderate amounts of altruism.
And while the United States has the reputation of a gang of heartless capitalists, it ranks as the most service-minded country among developed nations.
I can examine this more systematically when I have finished building a data set, but these patterns might reflect the religious culture of the people. The Catholic Church may have taught Puerto Ricans to believe in the importance of serving others, even if they don't always do it. On the other hand, Japanese people might be good neighbors, even though they don't have the same kind of religious culture.
Friday, August 18, 2006
Wealthy countries are the most trusting: Using the World Values Survey, I plan to develop a "personality" profile of regions around the world, much as I have been doing with American ethnic groups. As a first step, let's look at a country's level of cynicism. People all around the world were asked if most people try to take advantage of you: others were asked if it's true that you can't be too careful with people. Here are the results, from most to least cynical:
Percent saying most people try to take advantage of you
Moldova 83.3
Turkey 81.4
Peru 73.0
Morocco 71.4
Chile 70.9
Nigeria 70.8
Bosnia/Herzegovina 70.7
Mexico 69.8
Macedonia 69.5
Uganda 69.7
Venezuela 67.5
South Africa 67.4
Japan 66.4
Algeria 66.4
Pakistan 65.8
Puerto Rico 62.2
Bangladesh 61.6
Jordan 61.4
Argentina 60.6
India 59.5
Albania 57.5
Kyrgyzstan 55.4
Korea 54.4
Tanzania 52.7
Saudi Arabia 51.3
Singapore 51.0
Egypt 50.9
Spain 50.5
Iraq 43.5
USA 38.2
Iran 34.1
Canada 33.2
Indonesia 32.4
Vietnam 27.4
China 20.4
Sweden 12.6
Percent saying you can't be too careful with people
Brazil 97.2
Peru 95.0
Philippines 94.5
Puerto Rico 93.9
Turkey 93.5
Macedonia 91.8
Colombia 89.6
El Salvador 85.4
Slovenia 84.4
Argentina 82.5
Nigeria 82.3
Poland 82.1
South Africa 81.8
Georgia 81.3
Romania 81.3
Azerbaijan 79.5
Pakistan 79.4
Bangladesh 79.1
Estonia 78.5
Chile 78.1
Lithuania 78.1
Uruguay 77.9
Moldova 77.8
Hungary 77.3
Russia 76.1
Belarus 75.9
Armenia 75.3
Latvia 75.3
East Germany 75.1
Croatia 74.8
Dominican Republic 73.4
Albania 73.1
Slovakia 73.0
Bosnia and Herzegovina 71.7
Czech Republic 71.5
Bulgaria 71.4
Spain 70.2
Serbia 70.2
Korea 69.7
Great Britain 69.0
Ukraine 69.0
Mexico 68.8
Montenegro 67.7
USA 64.4
India 62.1
Australia 60.1
Switzerland 59.0
West Germany 58.2
Japan 54.0
Finland 51.2
New Zealand 50.8
China 47.7
Sweden 40.3
I see a few patterns here: Developed countries are the most trusting. China, however, is an example of a trusting, less developed nation. Other Asian countries also tend to be less cynical (the Philippines being a strong exception). As a group, Latin American countries are cynical, which contradicts my image of the gregarious Hispanic. Muslim, Eastern European, and Sub-Saharan African countries are on the cynical side (Iraq and Iran are important exceptions).
The explanation of these patterns is not clear, but attitudes may in some degree reflect experience. For example, a country like Sweden is an orderly, honest society, so living there inspires faith in human nature. A history of government corruption might be part of the story. Steve Sailer argues that high rates of cousin marriage create tightly-knit clans who are suspicious of each other, which might explain some of the Muslim cases. Do you see a connection between ethnic diversity and mistrust? I'm not sure. America seems to be on the less trustful end of wealthy countries. I plan to build a data set, so I can calculate correlations between variables like these.
Percent saying most people try to take advantage of you
Moldova 83.3
Turkey 81.4
Peru 73.0
Morocco 71.4
Chile 70.9
Nigeria 70.8
Bosnia/Herzegovina 70.7
Mexico 69.8
Macedonia 69.5
Uganda 69.7
Venezuela 67.5
South Africa 67.4
Japan 66.4
Algeria 66.4
Pakistan 65.8
Puerto Rico 62.2
Bangladesh 61.6
Jordan 61.4
Argentina 60.6
India 59.5
Albania 57.5
Kyrgyzstan 55.4
Korea 54.4
Tanzania 52.7
Saudi Arabia 51.3
Singapore 51.0
Egypt 50.9
Spain 50.5
Iraq 43.5
USA 38.2
Iran 34.1
Canada 33.2
Indonesia 32.4
Vietnam 27.4
China 20.4
Sweden 12.6
Percent saying you can't be too careful with people
Brazil 97.2
Peru 95.0
Philippines 94.5
Puerto Rico 93.9
Turkey 93.5
Macedonia 91.8
Colombia 89.6
El Salvador 85.4
Slovenia 84.4
Argentina 82.5
Nigeria 82.3
Poland 82.1
South Africa 81.8
Georgia 81.3
Romania 81.3
Azerbaijan 79.5
Pakistan 79.4
Bangladesh 79.1
Estonia 78.5
Chile 78.1
Lithuania 78.1
Uruguay 77.9
Moldova 77.8
Hungary 77.3
Russia 76.1
Belarus 75.9
Armenia 75.3
Latvia 75.3
East Germany 75.1
Croatia 74.8
Dominican Republic 73.4
Albania 73.1
Slovakia 73.0
Bosnia and Herzegovina 71.7
Czech Republic 71.5
Bulgaria 71.4
Spain 70.2
Serbia 70.2
Korea 69.7
Great Britain 69.0
Ukraine 69.0
Mexico 68.8
Montenegro 67.7
USA 64.4
India 62.1
Australia 60.1
Switzerland 59.0
West Germany 58.2
Japan 54.0
Finland 51.2
New Zealand 50.8
China 47.7
Sweden 40.3
I see a few patterns here: Developed countries are the most trusting. China, however, is an example of a trusting, less developed nation. Other Asian countries also tend to be less cynical (the Philippines being a strong exception). As a group, Latin American countries are cynical, which contradicts my image of the gregarious Hispanic. Muslim, Eastern European, and Sub-Saharan African countries are on the cynical side (Iraq and Iran are important exceptions).
The explanation of these patterns is not clear, but attitudes may in some degree reflect experience. For example, a country like Sweden is an orderly, honest society, so living there inspires faith in human nature. A history of government corruption might be part of the story. Steve Sailer argues that high rates of cousin marriage create tightly-knit clans who are suspicious of each other, which might explain some of the Muslim cases. Do you see a connection between ethnic diversity and mistrust? I'm not sure. America seems to be on the less trustful end of wealthy countries. I plan to build a data set, so I can calculate correlations between variables like these.
Americans Muslims make the "Religious Top 10 List": My earlier post showed that greater support for terrorism is sometimes seen among more religious Muslims (I emphasize sometimes). The General Social Survey asks people how often they attend religious services. Here is the top ten list:
1. National Baptist Convention of America
2. National Baptist Convention USA
3. African Methodist Episcopal Zion
4. Other Baptists
5. Evangelical Lutheran
6. Merged Presbyterian
7. Methodists (non-United)
8. Muslims
9. WI Evangelical Lutheran Synod
10. African Methodist Episcopal
Baptists in the number one spot go to church an average of almost once per week: for Muslims it's maybe twice a month. I'm mystified why the GSS does not ask if you're Mormon, Jehovah's Witness, etc., so we don't know about those groups. On the other end of the scale, the religious slackers are Buddhists, Jews, and Native Americans.
1. National Baptist Convention of America
2. National Baptist Convention USA
3. African Methodist Episcopal Zion
4. Other Baptists
5. Evangelical Lutheran
6. Merged Presbyterian
7. Methodists (non-United)
8. Muslims
9. WI Evangelical Lutheran Synod
10. African Methodist Episcopal
Baptists in the number one spot go to church an average of almost once per week: for Muslims it's maybe twice a month. I'm mystified why the GSS does not ask if you're Mormon, Jehovah's Witness, etc., so we don't know about those groups. On the other end of the scale, the religious slackers are Buddhists, Jews, and Native Americans.
Jews vs. Episcopalians, Part V: We've seen thus far that these two groups are similar in several ways (expect for income, where Jews make more). Let's finish up with a look at religious and political participation. Jews are one of these least religious groups in the country, at least as indicated by frequency of attendance at religious services. The average Jew goes perhaps a few times a year, whereas Episcopalians (Es) average about once a month. The numbers even out, however, when we broaden the question to membership in some kind of organization related to religion: 37% of Jews and 35% of Es says yes to this question.
As for politics, Jews are, not surprisingly, more liberal: only 22% voted for Bush in 2000, while 53% of Es did. Thirty-eight percent of Jews have given money to a political cause or candidate: for Es, the number is 33%. Fifty-six percent of Es have lobbied local politicians on some issue: 52% of Jews have. For higher-level officials, it's 52% of Jews and 50% of Es.
So along the dimensions I've looked at, these groups look quite similar, except that Jews have higher incomes, yet vote Democrat. The higher incomes might be explained simply by the fact that the average Jew lives in a city of 1.7 million people, while Es live in cities averaging only 450,000. (Both are concentrated on the east and west coasts). The two groups work similar hours: 41.2 hours/week for Jews and 42.4 for Es (this includes part-time workers).
As for politics, Jews are, not surprisingly, more liberal: only 22% voted for Bush in 2000, while 53% of Es did. Thirty-eight percent of Jews have given money to a political cause or candidate: for Es, the number is 33%. Fifty-six percent of Es have lobbied local politicians on some issue: 52% of Jews have. For higher-level officials, it's 52% of Jews and 50% of Es.
So along the dimensions I've looked at, these groups look quite similar, except that Jews have higher incomes, yet vote Democrat. The higher incomes might be explained simply by the fact that the average Jew lives in a city of 1.7 million people, while Es live in cities averaging only 450,000. (Both are concentrated on the east and west coasts). The two groups work similar hours: 41.2 hours/week for Jews and 42.4 for Es (this includes part-time workers).
Thursday, August 17, 2006
If a Muslim is more religious, is he more in favor of terrorism? I was interested in this question, so I analyzed recent data from the World Values Survey. In two countries--Pakistan and Algeria--thousands of people were asked if they approved of 9/11, as well as being asked how often they attend religious services.
Results differed for the two countries. First, 22.4% of Algerians approved (or strongly approved) of the attacks, whereas only 3.5% of Pakistanis did. In Algeria, more religious people were slightly more supportive: 26% of those going to services more than once a week favoring the terrorism: 21% of those who never go were supportive. By contrast, only 0.4% of frequent attenders in Pakistan were pro-terrorist, while 14.4% of those who rarely attend were.
Results differed for the two countries. First, 22.4% of Algerians approved (or strongly approved) of the attacks, whereas only 3.5% of Pakistanis did. In Algeria, more religious people were slightly more supportive: 26% of those going to services more than once a week favoring the terrorism: 21% of those who never go were supportive. By contrast, only 0.4% of frequent attenders in Pakistan were pro-terrorist, while 14.4% of those who rarely attend were.
The narrowest of victories: Jews 110, Episcopalians 109: Using the vocabulary test data from the General Social Survey, I estimated the IQs for American Jews and white Episcopalians (Es) (about 10% of Es are black). Setting the American white average at 100, Js come in at 110, which doesn't surprise me, and Es weigh in at 109, which makes them surprisingly similar to Jews. My Jewish estimate is lower than La Griffe's, which is 116. One reason mine is lower might be that La Griffe studied Ashkenazi Jews, and while most Jews are in the GSS sample are also Ashkenazi, 150,000 Jewish Americans are Sephardic--a group with a lower average IQ.
Studies of Jewish IQ have also noted more variation than in general populations, but according to the GSS, the standard deviation is only slightly larger than that of all white Americans (or Es).
Studies of Jewish IQ have also noted more variation than in general populations, but according to the GSS, the standard deviation is only slightly larger than that of all white Americans (or Es).
Wednesday, August 16, 2006
Jews vs. Episcopalians, Part III: Let's continue to gain perspective on two of America's important religious groups. A very simple question is: which group is bigger? According to the General Social Survey, 1.99% (or 5.9 million) of Americans are Jewish, and 2.02% (or 6 million) are Episcopalian. Almost identical in size.
Tuesday, August 15, 2006
Jews vs. Episcopalians, Part II: We saw in Part I that Jews (Js), on average, have larger incomes than Episcopalians (Es), but is that simply due to higher status jobs? I looked at average occupational prestige scores (that range from 0 to 100) and found that it was 51.7 for Js and 49.5 for Es. This is not much of a difference.
Monday, August 14, 2006
Jews vs. Episcopalians, Part I: I thought it would be interesting to compare two high-status religious groups in America. The General Social Survey does not allow us to look at elites within these two communities, but we can see how groups compare overall. Let's begin with income. For 2004, the average Jew is roughly $60k, while the typical Espicopalian is approximately $40k, so there is no comparison in terms of income.
I also noticed that Episcopalians have a larger standard deviation which indicates a broader range of incomes within this group.
I also noticed that Episcopalians have a larger standard deviation which indicates a broader range of incomes within this group.
Saturday, August 12, 2006
Do you have to be dishonest to be successful? Watching politicians all these years has made me wonder if only crooks rise to the top of society. (At least I feel this way in my cynical moments.) The General Social Survey offers more hopeful evidence. Occupational prestige ranges from 0 to 100: here are the averages at each level of disapproval of cheating on taxes:
It's not wrong 37.9
It's a bit wrong 43.2
It's wrong 43.0
It's seriously wrong 44.7
More successful people are less permissive of tax evasion, not more. Now granted, this is attitude and not behavior, but the two are probably correlated. I imagine that envy makes it easy for us to exaggerate the flaws of people above us.
It's not wrong 37.9
It's a bit wrong 43.2
It's wrong 43.0
It's seriously wrong 44.7
More successful people are less permissive of tax evasion, not more. Now granted, this is attitude and not behavior, but the two are probably correlated. I imagine that envy makes it easy for us to exaggerate the flaws of people above us.
Friday, August 11, 2006
The Vulva Puppet!!!

I got to thinking that I was a bit unfair in the previous post--I must admit that feminism has given us the...vulva puppet!!! You've got to own one of these cute, cuddly things for yourself, so go to: http://www.yoni.com/loverf/vulvaintro.shtml
The wondrous blessing of feminism: Feminists cherish female autonomy and have thus championed the pursuit of a career. Abortion freedom has become a core value of liberals because it also preserves independence. Sociologists have established that the main cause of the increase in divorce over the last 5 decades is the movement of women into the workplace. (And sociologists would rather suffer genital electrocution than produce a conservative finding). So tens of millions of our young ones have either experienced the divorce of their parents or, slightly worse, death in order to keep women freer. Seems like the cost is a tad heavy, but at least women are happier. Uhm, no they're not: according to the General Social Survey, women are not one bit happier than they were in 1972. Death and trauma reign down on our little ones for nothing.
Wednesday, August 09, 2006
Misanthropy at Time: Barbara Ehrenreich opined in Time magazine last week that the reason why there is a shortage of men in college is that they are lazy and party-minded. Of course, if a man had the audacity to suggest that women might be few in number in university math departments because of some personal trait--in this case math stupidity--he would be called a misogynist, and he might lose his job. According to the GSS, the average male college student goes to a bar once a month; the typical female student, several times a year. This is not enough a difference, nor is it indicative of enough male irresponsibility to explain why 60% of college students are girls.
Tuesday, August 08, 2006
Note sent to Steve Sailer on narrowing black-white IQ gap:
Steve,
For what it's worth, GSS vocabulary data support Flynn and Dicken's finding that black and white IQs have converged a bit. The gap went from .79 standard deviations (SDs) in the 1970s to .62 in this decade--a narrowing of .17 SDs. I looked at recent data, and the age group with the highest vocab scores were born in the late 50s and early 60s. Perhaps they escaped both the environmental deficits of segregation and the more recent meltdown of black families and neighborhoods and the takeover by hip hop culture.
Ron
Steve,
For what it's worth, GSS vocabulary data support Flynn and Dicken's finding that black and white IQs have converged a bit. The gap went from .79 standard deviations (SDs) in the 1970s to .62 in this decade--a narrowing of .17 SDs. I looked at recent data, and the age group with the highest vocab scores were born in the late 50s and early 60s. Perhaps they escaped both the environmental deficits of segregation and the more recent meltdown of black families and neighborhoods and the takeover by hip hop culture.
Ron
Gay men are the smartest: I have long suspected that gay men are, on average, smarter than straights. This impression has come from several different places, but perhaps it has been sharpest when reading about English intellectual elites (e.g., Wilde, Forster, Keynes, Auden). The pattern is weaker for lesbians but seems plausible. The General Social Survey asked 8,500 people about sexual orientation and also gave them a vocabulary test, which is a rough measure of IQ. Here are the results:
Mean score (out of 10) on vocab test:
Gay men 6.67
Lesbians 6.55
Straight women 6.20
Straight men 6.10
Bisexual women 5.76
Bisexual men 5.38
With a standard deviation of roughly 2, gay men are clearly smarter (at least in verbal IQ) than their hetero counterparts, but the gap is not as big as, say, between Jews and non-Jews. (Jews averaged 7.65 on this test). Lesbians also outscore straight women, and as we have seen with other indicators of functioning, bisexual women and especially men fall to the bottom. While homosexuality does not seem to indicate maladjustment, bisexuality does.
Now it is possible that smarter people may reject convention more often than others and select themselves into homosexuality, but perhaps there is some other mechanism here. Perhaps homosexuals are drawn to environments that are more accepting of them which also happen to be rich verbally. One might argue that homosexuals enjoy the female advantage in verbal ability, but this must also apply to lesbians who have a high average, and both of these groups surpass straight females by quite a bit. Perhaps it's more self-selection for lesbians, and hyper-femaleness for gay men. Gay achievement might be explained by a fortunate combination of male competitive drive with female verbal fluency. Other ideas?
Mean score (out of 10) on vocab test:
Gay men 6.67
Lesbians 6.55
Straight women 6.20
Straight men 6.10
Bisexual women 5.76
Bisexual men 5.38
With a standard deviation of roughly 2, gay men are clearly smarter (at least in verbal IQ) than their hetero counterparts, but the gap is not as big as, say, between Jews and non-Jews. (Jews averaged 7.65 on this test). Lesbians also outscore straight women, and as we have seen with other indicators of functioning, bisexual women and especially men fall to the bottom. While homosexuality does not seem to indicate maladjustment, bisexuality does.
Now it is possible that smarter people may reject convention more often than others and select themselves into homosexuality, but perhaps there is some other mechanism here. Perhaps homosexuals are drawn to environments that are more accepting of them which also happen to be rich verbally. One might argue that homosexuals enjoy the female advantage in verbal ability, but this must also apply to lesbians who have a high average, and both of these groups surpass straight females by quite a bit. Perhaps it's more self-selection for lesbians, and hyper-femaleness for gay men. Gay achievement might be explained by a fortunate combination of male competitive drive with female verbal fluency. Other ideas?
Sunday, July 30, 2006
Saturday, July 29, 2006
Liberals say tax evasion is no biggie: Conservatives are the government haters just looking for any chance to get around paying taxes, while liberals seek the collective good by looking for ways to pay extra, right? According to the GSS, 43.7% of extreme conservatives say it's seriously wrong to cheat on your taxes. For extreme liberals, it's a whopping 10.9%. But let me anticipate some of you: it's always conservatives who lie on surveys.
Friday, July 28, 2006
Evidently, education still stinks for many blacks in the South: Steve Sailer pointed to improvements in education in the South as a possible reason for vocab gains among blacks in last few decades. So I looked at trends for 9 U.S. regions for both blacks and whites, and this is what I found:
Blacks--mean vocab score (out of 10) and % change since 1970s
1. West North Central 5.55 (+11.0)
2. Middle Atlantic 5.38 (+10.2)
3. West South Central 5.32 (+14.4)
4. East North Central 5.28 (+9.8)
5. South Atlantic 5.00 (-11.8)
6. Pacific 4.87 (-10.8)
7. East South Central 4.68 (-16.4)
(I excluded the New England and Mountain regions because of small sample sizes.) While the WSC region has seen big improvements (TX, OK, LA, AR) the rest of the South has actually gotten worse. The Pacific region also sunk 10.8%.
Whites--mean vocab score (out of 10) and % change since 1970s
1. New England 6.86 (+2.7)
2. Pacific 6.79 (+6.0)
3. Mountain 6.71 (+7.0)
4. West North Central 6.44 (+3.5)
5. Middle Atlantic 6.39 (-3.9)
6. South Atlantic 6.38 (+12.5)
7. East North Central 6.16 (+1.0)
8. West South Central 6.15 (+2.7)
9. East South Central 5.86 (+4.6)
For whites, New England is about to lose it's first place position to either the Pacific (or even Mountain) region. California has been losing a lot of working- class whites with modest vocabs. What is intersting is that the mountain states have been absorbing many of those migrants, and yet have improved slightly more than California has. The other big gainer has been the South Atlantic which includes DE, MD, and DC, along with all the other states you would think would go in this category.
One pattern I notice is that improvement has been more consistently positive for whites across the country (albeit modest in some places) while regions have varied more for blacks. Is this due to a greater standard deviation of environments for blacks?
Another thing I see (and the data from this decade are no different from what I have seen before) is that the dumbest whites and the dumbest blacks like to live in Kentucky, Tennessee, Alabama, and Mississippi. Is it somethin' in the cookin' down there? The problem is that, according to these data, the white folks there are moving up while the black folks are slipping farther behind. But whites there better not get cocky because if current trends continue, they could get passed up by blacks from places like Nebraska and Minnesota.
Blacks--mean vocab score (out of 10) and % change since 1970s
1. West North Central 5.55 (+11.0)
2. Middle Atlantic 5.38 (+10.2)
3. West South Central 5.32 (+14.4)
4. East North Central 5.28 (+9.8)
5. South Atlantic 5.00 (-11.8)
6. Pacific 4.87 (-10.8)
7. East South Central 4.68 (-16.4)
(I excluded the New England and Mountain regions because of small sample sizes.) While the WSC region has seen big improvements (TX, OK, LA, AR) the rest of the South has actually gotten worse. The Pacific region also sunk 10.8%.
Whites--mean vocab score (out of 10) and % change since 1970s
1. New England 6.86 (+2.7)
2. Pacific 6.79 (+6.0)
3. Mountain 6.71 (+7.0)
4. West North Central 6.44 (+3.5)
5. Middle Atlantic 6.39 (-3.9)
6. South Atlantic 6.38 (+12.5)
7. East North Central 6.16 (+1.0)
8. West South Central 6.15 (+2.7)
9. East South Central 5.86 (+4.6)
For whites, New England is about to lose it's first place position to either the Pacific (or even Mountain) region. California has been losing a lot of working- class whites with modest vocabs. What is intersting is that the mountain states have been absorbing many of those migrants, and yet have improved slightly more than California has. The other big gainer has been the South Atlantic which includes DE, MD, and DC, along with all the other states you would think would go in this category.
One pattern I notice is that improvement has been more consistently positive for whites across the country (albeit modest in some places) while regions have varied more for blacks. Is this due to a greater standard deviation of environments for blacks?
Another thing I see (and the data from this decade are no different from what I have seen before) is that the dumbest whites and the dumbest blacks like to live in Kentucky, Tennessee, Alabama, and Mississippi. Is it somethin' in the cookin' down there? The problem is that, according to these data, the white folks there are moving up while the black folks are slipping farther behind. But whites there better not get cocky because if current trends continue, they could get passed up by blacks from places like Nebraska and Minnesota.
Wednesday, July 26, 2006
Perhaps the rising vocabs are due to more education, or both are due to increasing...something: A reader suggested as a straightforward explanation that whites and especially blacks are doing better on the GSS vocabulary test because they are staying in school longer. I calculated the mean years of schooling for both races for each of the past four decades to see if the pattern matches the vocab trends. They look to me like they do. Take a look:
Blacks--mean years of schooling
70s 10.2
80s 11.4
90s 12.3
00s 12.6
Whites--mean years of schooling
70s 11.9
80s 12.5
90s 13.3
00s 13.6
With vocab, we saw a steady improvement among blacks. We see that here too, although the rate of increase in education shrinks over time. With whites, they only saw improvements in knowledge of words between the 80s and 90s. Like blacks, their educational levels have improved every decade since the early 70s, but the biggest increase was between the 80s and 90s, the same span of time that they developed better vocabs.
In the past 3 or 4 decades, many more Americans are getting at least some college experience, and college is a place where many people hear words they rarely hear any place else--the very words that are likely to show up on a vocab test. This is especially true of blacks.
Or, something deeper is going on which has raised educational and word knowledge levels together? Have people gotten smarter, hungrier for learning because of better nutrition perhaps? This sounds more plausible if we're talking about the beginning of the century, not the end of it. Perhaps the growth of the "information society", which pushes people to stay in school and exposes them to more novel words? What do you think?
Blacks--mean years of schooling
70s 10.2
80s 11.4
90s 12.3
00s 12.6
Whites--mean years of schooling
70s 11.9
80s 12.5
90s 13.3
00s 13.6
With vocab, we saw a steady improvement among blacks. We see that here too, although the rate of increase in education shrinks over time. With whites, they only saw improvements in knowledge of words between the 80s and 90s. Like blacks, their educational levels have improved every decade since the early 70s, but the biggest increase was between the 80s and 90s, the same span of time that they developed better vocabs.
In the past 3 or 4 decades, many more Americans are getting at least some college experience, and college is a place where many people hear words they rarely hear any place else--the very words that are likely to show up on a vocab test. This is especially true of blacks.
Or, something deeper is going on which has raised educational and word knowledge levels together? Have people gotten smarter, hungrier for learning because of better nutrition perhaps? This sounds more plausible if we're talking about the beginning of the century, not the end of it. Perhaps the growth of the "information society", which pushes people to stay in school and exposes them to more novel words? What do you think?
Tuesday, July 25, 2006
The "Flynn effect" observed in GSS data: Now we can't get too excited about measuring IQ with 10 vocabulary questions, but what the heck--this is a blog, not Intelligence. The GSS has been asking vocab questions since the early 70s, so I averaged the number correct out of 10 for blacks and whites. Here they are:
Blacks
70s 4.59
80s 4.69
90s 4.97
00s 5.15
Whites
70s 6.17
80s 6.14
90s 6.33
00s 6.39
So we see increases for both groups, but it's larger for blacks. While whites increased 4% over the period, black averages rose 13%. One bit of evidence that this measure is not just nonsense is that we see the consistent, large gap between blacks and whites, like a guzillion IQ studies have shown. And there has been some narrowing of the gap over the period.
Now it's possible that the words got easier--I don't know if they used the same words every year, and it's too late for me to look the damn thing up. I will say that if the test got easier, then why did whites only improve between the 80s and 90s while blacks improved every decade? And why did blacks improve more? I thought as people age, they might gradually pick up more words, and while it's true that mean white age rose 2.6 years over the period, blacks dropped .4 of a year. And whites aged gradually from the early 70s until now, while their vocabs only improved between the 80s and 90s. Comments are appreciated, and maybe I'll try to see what explains the increase later.
Blacks
70s 4.59
80s 4.69
90s 4.97
00s 5.15
Whites
70s 6.17
80s 6.14
90s 6.33
00s 6.39
So we see increases for both groups, but it's larger for blacks. While whites increased 4% over the period, black averages rose 13%. One bit of evidence that this measure is not just nonsense is that we see the consistent, large gap between blacks and whites, like a guzillion IQ studies have shown. And there has been some narrowing of the gap over the period.
Now it's possible that the words got easier--I don't know if they used the same words every year, and it's too late for me to look the damn thing up. I will say that if the test got easier, then why did whites only improve between the 80s and 90s while blacks improved every decade? And why did blacks improve more? I thought as people age, they might gradually pick up more words, and while it's true that mean white age rose 2.6 years over the period, blacks dropped .4 of a year. And whites aged gradually from the early 70s until now, while their vocabs only improved between the 80s and 90s. Comments are appreciated, and maybe I'll try to see what explains the increase later.
Sunday, July 23, 2006
According to the "foot vote," European immigrants say that New England is the best place to live in America: A reader brought up the question of desirable living places, as indicated by migration. While I cannot answer his specific questions (at least for now) I can look at the GSS to see where immigrants to the U.S. from wealthy European countries choose to live. The GSS only allows us to look at 9 regional divisions of the country, so I identified regions which had more European immigrants than would be predicted by total immigration patterns. Below I've listed the 9 divisions and the groups overrepresented there (and those in parentheses are underrepresented):
New England
French Canadians
Irish
Italians
Middle Atlantic
Italians
(English)
(French)
(Germans)
East North Central
Austrians
Dutch
West North Central
Germans
South Atlantic
English
East South Central
none
West South Central
Germans
Mountain
English
Scots
Pacific
(Italians)
(Austrians)
(French Canadians)
A couple of points: First, it looks like there is a tendency for immigrants from wealthy European countries to go regions where there are concentrations of their co-ethnics. We know that much immigration is family-based. Second, these immigrants are gravitating to whiter regions. New England is the whitest division, and it has 3 overrepresented immigrant groups and no underrepresented ones. East North Central and Mountain regions have 2 pluses and no minuses. The increasingly non-white Pacific region has 3 underrepresented groups. So judging by European immigration, New England is the most desirable place to live in America.
New England
French Canadians
Irish
Italians
Middle Atlantic
Italians
(English)
(French)
(Germans)
East North Central
Austrians
Dutch
West North Central
Germans
South Atlantic
English
East South Central
none
West South Central
Germans
Mountain
English
Scots
Pacific
(Italians)
(Austrians)
(French Canadians)
A couple of points: First, it looks like there is a tendency for immigrants from wealthy European countries to go regions where there are concentrations of their co-ethnics. We know that much immigration is family-based. Second, these immigrants are gravitating to whiter regions. New England is the whitest division, and it has 3 overrepresented immigrant groups and no underrepresented ones. East North Central and Mountain regions have 2 pluses and no minuses. The increasingly non-white Pacific region has 3 underrepresented groups. So judging by European immigration, New England is the most desirable place to live in America.
Friday, July 21, 2006
Mexican-Americans rank dead last on vocabulary, while Jews rank first--big surprise: The GSS asks respondents 10 vocabulary words. Below are the average number of correct answers for various American ethnic groups. I included only those born here since immigrants are at a disadvantage:
1. Jews 7.65
2. Chinese 7.17
3. Lithuanians (non-Jewish) 7.12
4. Austrians (non-Jewish) 7.00
5. English/Welsh 6.85
6. Danes 6.84
7. Scots 6.72
7. Yugoslavs 6.72
9. Russians (non-Jewish) 6.71
10. Norwegians 6.65
11. Swiss 6.64
12. Swedes 6.60
13. Hungarians (non-Jewish) 6.58
13. Finns 6.58
15. Japanese 6.54
16. Czechs 6.51
17. Irish 6.42
18. Greeks 6.41
19. Italians 6.40
20. Poles (non-Jewish) 6.36
21. French 6.30
22. Germans 6.28
23. French Canadians 6.19
U.S. average 6.17
24. Portuguese 6.13
25. West Indians 6.10
26. Rumanians (non-Jewish) 6.00
26. Arabs 6.00
26. East Indians 6.00
26. Belgians 6.00
30. Dutch 5.89
31. Spain 5.73
32. Filipinos 5.27
33. American Indians 5.20
34. Blacks 5.04
35. Puerto Ricans 4.99
36. Mexicans 4.83
Jews are in a class all their own here. Compared to Mexican-Americans, they answered 60% more of the questions correctly. They inflated substantially the means of several countries, so I excluded them where they did. Whites are generally in the top half, while poor minorities, especially those who use English less at home, drop to the bottom. Mexicans might work hard at some things, but not at building up a decent vocabulary. The exceptions to this pattern are Chinese Americans who are ranked second, and the Japanese who are above average (but significantly below the Chinese). The Dutch and Belgians are white groups who rank toward the bottom. Those from Spain are even lower--there is a tendency for southern Europeans to have poor rankings.
Comparing these numbers to national IQ estimates (Lynn's work) most of the rankings are similar, but a few are strange. Japan has the highest average IQ of any nation (except for South Korea, perhaps), but does not rank so high in this list. (Of course, NE Asians are strongest on visio-spatial skills, but why then are the Chinese at the top of my list?) Studies of Belgians and the Dutch estimate IQs around 100, but the numbers here are much lower. Spain is in the high 90s, but it ranks 31st in this list. (Some Hispanics might say they are from Spain). In my list, Greek Americans are above average, but according to Lynn, Greece is in the low 90s. Of course, some differences could be explained by immigrants and their descendants being different from the average back home. This might explain how West Indians score almost the U.S. average in terms of vocabulary. My numbers seem right for Filipinos since they have low average IQs, but that fact is at odds with all my other posts which show that Filipinos are high quality immigrants.
1. Jews 7.65
2. Chinese 7.17
3. Lithuanians (non-Jewish) 7.12
4. Austrians (non-Jewish) 7.00
5. English/Welsh 6.85
6. Danes 6.84
7. Scots 6.72
7. Yugoslavs 6.72
9. Russians (non-Jewish) 6.71
10. Norwegians 6.65
11. Swiss 6.64
12. Swedes 6.60
13. Hungarians (non-Jewish) 6.58
13. Finns 6.58
15. Japanese 6.54
16. Czechs 6.51
17. Irish 6.42
18. Greeks 6.41
19. Italians 6.40
20. Poles (non-Jewish) 6.36
21. French 6.30
22. Germans 6.28
23. French Canadians 6.19
U.S. average 6.17
24. Portuguese 6.13
25. West Indians 6.10
26. Rumanians (non-Jewish) 6.00
26. Arabs 6.00
26. East Indians 6.00
26. Belgians 6.00
30. Dutch 5.89
31. Spain 5.73
32. Filipinos 5.27
33. American Indians 5.20
34. Blacks 5.04
35. Puerto Ricans 4.99
36. Mexicans 4.83
Jews are in a class all their own here. Compared to Mexican-Americans, they answered 60% more of the questions correctly. They inflated substantially the means of several countries, so I excluded them where they did. Whites are generally in the top half, while poor minorities, especially those who use English less at home, drop to the bottom. Mexicans might work hard at some things, but not at building up a decent vocabulary. The exceptions to this pattern are Chinese Americans who are ranked second, and the Japanese who are above average (but significantly below the Chinese). The Dutch and Belgians are white groups who rank toward the bottom. Those from Spain are even lower--there is a tendency for southern Europeans to have poor rankings.
Comparing these numbers to national IQ estimates (Lynn's work) most of the rankings are similar, but a few are strange. Japan has the highest average IQ of any nation (except for South Korea, perhaps), but does not rank so high in this list. (Of course, NE Asians are strongest on visio-spatial skills, but why then are the Chinese at the top of my list?) Studies of Belgians and the Dutch estimate IQs around 100, but the numbers here are much lower. Spain is in the high 90s, but it ranks 31st in this list. (Some Hispanics might say they are from Spain). In my list, Greek Americans are above average, but according to Lynn, Greece is in the low 90s. Of course, some differences could be explained by immigrants and their descendants being different from the average back home. This might explain how West Indians score almost the U.S. average in terms of vocabulary. My numbers seem right for Filipinos since they have low average IQs, but that fact is at odds with all my other posts which show that Filipinos are high quality immigrants.
Thursday, July 20, 2006
Don't trust social science researchers: A colleague told me once that research shows that one's college experience does not affect political orientation. I told him I was skeptical of this idea since colleges live to crank out fresh liberals. I know most professors put people to sleep, but you mean to tell me four years of indoctrination does not work? Well, let's see what the all-wise, all-knowing GSS says. I looked at the question about your politics ranging from extremely liberal (1) through extremely conservative (7).
Here are the means for freshman through seniors:
Mean "conservatism" score:
Freshman 4.47
Sophomores 3.53
Juniors 3.46
Seniors 3.40
We see here a very clear move left as one accumulates years of college. The freshman average is between moderate (4) and slightly conservative (5), while seniors are between moderate and slightly liberal (3).
I recommend that you folks do as much data analysis of your own as you can because, frankly, I don't trust social science researchers.
Here are the means for freshman through seniors:
Mean "conservatism" score:
Freshman 4.47
Sophomores 3.53
Juniors 3.46
Seniors 3.40
We see here a very clear move left as one accumulates years of college. The freshman average is between moderate (4) and slightly conservative (5), while seniors are between moderate and slightly liberal (3).
I recommend that you folks do as much data analysis of your own as you can because, frankly, I don't trust social science researchers.
Wednesday, July 19, 2006
There are more American Indian than Mexican voters: I looked at the 2000 presidential election (GSS data, like usual) to see the relative size of ethnic groups that voted. It looked like this:
Share of voters
1. Germans 16.9%
2. English/Welsh 14.7
3. Irish 14.3
4. Blacks 9.4
5. Italians 5.5
6. Scots 4.2
7. American Indians 3.9
8. Mexicans 2.8
9. Poles 2.6
10. French 2.0
11. Swedes 1.8
12. Norwegians 1.9
13. Russians 1.8
14. Dutch 1.3
15. Puerto Ricans 1.1
16. Filipinos 0.6
17. Chinese 0.6
These data support Steve Sailer's argument that Mexicans nationally are still a tiny group of voters. I can't remember the last time I laid eyes on an American Indian (AI), but even their numbers are substantially larger. If Republicans want to feel multicultural, why don't they go after a larger AI vote? After all, Republicans are like Indians--they are manly and aren't whiny, they love freedom, and tobacco. Ten percent of New Mexico is AI, and that is a swing state. In 2000, 56% of AIs voted for Bush, but only 46% voted at all, so why don't they have a "get out the AI vote?"
More later....
Share of voters
1. Germans 16.9%
2. English/Welsh 14.7
3. Irish 14.3
4. Blacks 9.4
5. Italians 5.5
6. Scots 4.2
7. American Indians 3.9
8. Mexicans 2.8
9. Poles 2.6
10. French 2.0
11. Swedes 1.8
12. Norwegians 1.9
13. Russians 1.8
14. Dutch 1.3
15. Puerto Ricans 1.1
16. Filipinos 0.6
17. Chinese 0.6
These data support Steve Sailer's argument that Mexicans nationally are still a tiny group of voters. I can't remember the last time I laid eyes on an American Indian (AI), but even their numbers are substantially larger. If Republicans want to feel multicultural, why don't they go after a larger AI vote? After all, Republicans are like Indians--they are manly and aren't whiny, they love freedom, and tobacco. Ten percent of New Mexico is AI, and that is a swing state. In 2000, 56% of AIs voted for Bush, but only 46% voted at all, so why don't they have a "get out the AI vote?"
More later....
Monday, July 17, 2006
Smart people are politically more extreme: A reader hypothesized that smart people tend to have more extreme political views, and suggested a post on the educational levels of third party voters as a test of this. According to the GSS, Americans with graduate degrees were 12.1% of voters, but were 20.0% of Nader voters. While 2.5% of voters opted for Nader, 4.1% of those with advanced degrees voted for him.
Bush should thank lazy, illiterate liberals! I was interested in how true is the idea that Democrats lose votes because people sympathetic to their views are less likely to vote, and due to high school dropouts not voting as much. Here's the breakdown of the percent who voted in the presidential election in 2000:
Percent voting in 2000
Extremely liberal 60.2%
Liberal 61.8
Slightly liberal 67.2
Moderates 59.9
Slightly conservative 70.2
Conservative 74.2
Extremely conservative 70.5
Look at the lazy liberals! God bless 'em! (Well, maybe not in the case of Bush). They are no more likely to vote than moderates. I was told that liberals are the ones who truly care about democracy, but it's conservatives who actually behave like it's important.
Percent voting in 2000
less than high school 38.3%
high school 60.8
junior college 72.4
bachelor's 79.0
graduate degree 84.3
Wow, people with bachelor's degree (or more) are twice as likely to vote as high school dropouts. It does look like Democrats suffer a lot from liberals and illiterates not voting, but I'm not going to lose any sleep over people not casting ballots who can't spell "casting" or "ballot".
Bush should thank lazy, illiterate liberals! I was interested in how true is the idea that Democrats lose votes because people sympathetic to their views are less likely to vote, and due to high school dropouts not voting as much. Here's the breakdown of the percent who voted in the presidential election in 2000:
Percent voting in 2000
Extremely liberal 60.2%
Liberal 61.8
Slightly liberal 67.2
Moderates 59.9
Slightly conservative 70.2
Conservative 74.2
Extremely conservative 70.5
Look at the lazy liberals! God bless 'em! (Well, maybe not in the case of Bush). They are no more likely to vote than moderates. I was told that liberals are the ones who truly care about democracy, but it's conservatives who actually behave like it's important.
Percent voting in 2000
less than high school 38.3%
high school 60.8
junior college 72.4
bachelor's 79.0
graduate degree 84.3
Wow, people with bachelor's degree (or more) are twice as likely to vote as high school dropouts. It does look like Democrats suffer a lot from liberals and illiterates not voting, but I'm not going to lose any sleep over people not casting ballots who can't spell "casting" or "ballot".
Tuesday, July 11, 2006
All you men out there, I've got news that will restore your self-esteem! Bonehead researchers studying penis length traditionally allowed participants to measure themselves. That's like allowing a student to grade himself. So the average finding was generally over 6 inches, and millions of men who feared they were inferior from watching porn felt it must be true if research said so. Well, one group of researchers had some sense and did the measuring themselves. The average from groin to tip was 5.1 inches. So gentlemen, cheer up! You're not as bad as you thought! Now, I know of you HBD guys have race on your minds, but I'll have to get back to you on the composition of the sample. (Wessells, H. et al. 1996. Journal of Urology 156:995)
Monday, July 10, 2006
A meta-analysis showing that blacks have higher rates of psychopathy: As Michael Levin has written, sometimes it sounds like the only difference between whites and blacks is IQ. I suspect it is more accurate to ask where aren't we different: |
Putative ethnic group differences in various forms of psychopathology may have important theoretical, clinical, and policy implications. Recently, it has been argued that individuals of African descent are more likely to be psychopathic than those of European descent (R. Lynn, 2002). Preliminary evidence from the Psychopathy Checklist: Youth Version (A. Forth, D. Kosson, & R. Hare, 2003) offers some support for this contention, with Black youths rated as moderately higher (Cohen's d = .61) than White youths in a large institutional sample (n = 945). To examine this issue more exhaustively, the authors meta-analyzed adolescent psychopathy data from several studies (combined N = 2,199) and obtained a much smaller mean difference (dw = .20, p = .03), although considerable heterogeneity was evident among the effect sizes. (McKoy WK and JF Edens. 2006. J Clin Consult Psych.)
Sunday, July 09, 2006
More on dislike for blacks: As a follow-up to the previous post, a reader suggested that, on average, Jews might have less warm feelings toward blacks than Christians. I looked at the GSS and found that Christians, Jews, and those with no religion all had around 88% feeling warm or neutral.
As an aside, only 2.3% of white respondents said "very cool." Even if it is an underestimate, it is hardly supportive of the view that somewhere hidden under every white-bread suburbanite lurks a Klansman waiting to get out.
As an aside, only 2.3% of white respondents said "very cool." Even if it is an underestimate, it is hardly supportive of the view that somewhere hidden under every white-bread suburbanite lurks a Klansman waiting to get out.
Saturday, July 08, 2006
Do conservatives dislike blacks? One vicious claim by liberals is that conservatives are racists. Is it true? I analyzed data from the General Social Survey and found that 81.25% of libs say they have warm or neutral feelings toward blacks (and, of course, pledging undying love for our darker brothers is mandatory, even if you are lying). So maybe half as many cons? Wrong--the actual number is 87.7%. (In the interest of full disclosure, cons had more neutrals, which is, incidentally, consistent with their belief in color-blindness).
Thursday, July 06, 2006
Diversity breeds violence
A quick glance at one of my university's periodical databases produced three studies showing that communities and nations with more ethnic diversity have more violence. This isn't the least bit surprising, but you'll never hear it talked about by the MSM as an important reason why the U.S. has a high homicide rate, or how perhaps diversity is a burden, not a godsend.
1. Osgood, Wayne et al. 2000. Criminology.
2. Roundtree, Pamela et al. 2000. Criminology.
3. Hoskin, Anthony. 2001. Justice Quarterly.
1. Osgood, Wayne et al. 2000. Criminology.
2. Roundtree, Pamela et al. 2000. Criminology.
3. Hoskin, Anthony. 2001. Justice Quarterly.
Consistent with the male predisposition for violence, they are more supportive of abortion on demand!
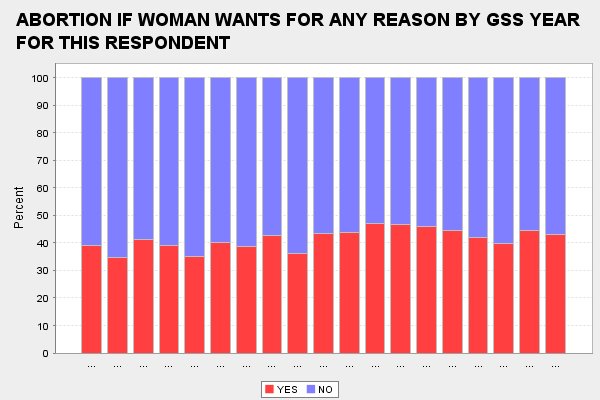
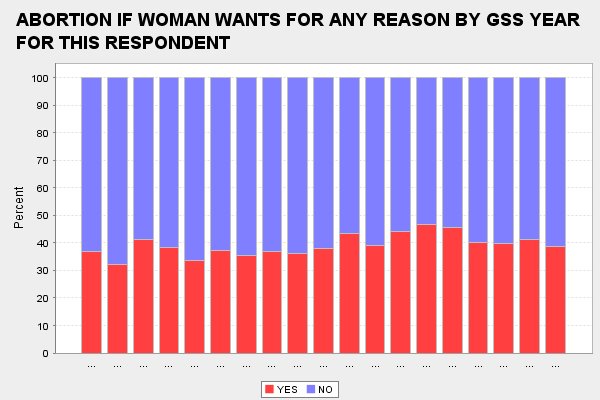
The National Organization for Women sells buttons that say, "If men got pregnant, abortion would be a sacrament." Yes, reproductive rights would be much more secure if it wasn't for misogynist men. The GSS has asked respondents since 1972 if abortion should be allowed for any reason if a women wants it. It may be difficult to see it in these graphs (men above, women below), but of the 19 years that the question was asked, women had a higher percent in favor compared to men exactly 3 times. Overall all the years, 41.2% of men support abortion on demand, versus 39.2% of women. And why wouldn't men support it more: they like sex without responsibility even more than today's women.
Wednesday, July 05, 2006
Political moderation shrinks as years of schooling grow

This graph shows the political orientation of people who completed various years of education. Starting from the bottom color and moving up, extreme liberals are disproportionately high school dropouts and overeducated eggheads. In addition, more years of education is accompanied by a greater share of liberals and slight liberals. Moderates are concentrated among the least educated, and are just barely the modal category among those with the most years of school. Conservatives and slight conservatives are found most often among the sensible, college-educated, but extreme conservatives are most often found among high school dropouts.
Tuesday, July 04, 2006
Blacks are most likely to say they have no ethnicity except "American": The General Social Survey indicates that almost all Americans say they belong to some ethnic group or groups. Only 2.5% say they are American and nothing more. This shows that ethnicity has not completely vanished from the American scene, but the interesting part is that of all the various factors I looked at, being black was by far the best predictor of saying that you do not identify with some group outside of the United States. Looking at the numbers below, 12.8% of them say this. Sixty-one percent of the people who say their identity is "American only" are black, even though blacks are only 12% of the U.S. population. Thirty-seven percent are white and only 2 percent of them are from the "other" racial category. So it seems that there is a small but significant share of blacks who feel no connection to Africa whatsoever.
Race
Blacks 12.8%
Whites 1.2
Others 1.6
Sex
Female 3.3%
Male 2.0
Degree
Less than high school 5.0%
Graduate 0.8
Occupational prestige
Low 4.2%
High 1.4
Income
Low 3.2%
High 1.3
Religion
Protestant 3.7%
Catholic 1.2
Jewish 0.7
None 1.9
Native-born
Yes 2.7%
No 0.5
Race
Blacks 12.8%
Whites 1.2
Others 1.6
Sex
Female 3.3%
Male 2.0
Degree
Less than high school 5.0%
Graduate 0.8
Occupational prestige
Low 4.2%
High 1.4
Income
Low 3.2%
High 1.3
Religion
Protestant 3.7%
Catholic 1.2
Jewish 0.7
None 1.9
Native-born
Yes 2.7%
No 0.5
Monday, July 03, 2006
Which group makes the best fathers? The growth in father absence is one of more alarming trends in recent American history. It has become the norm in black neighborhoods. So in this age of irresponsibility, who is doing the best job of getting and staying married when children are born? Here is the percent of fathers who are married for various American ethnic groups (from the GSS):
1. East Indians 95.5
2. Filipinos 94.4
3. French Canadians 90.0
4. Poles 82.1
5. English/Welsh 80.0
6. Dutch 74.5
7. Mexicans 74.4
8. Chinese 72.2
8. Scots 72.2
10. Irish 71.9
11. Italians 70.9
12. Germans 70.8
13. Norwegians 68.0
13. American Indians 68.0
15. French 65.4
16. Puerto Ricans 59.5
17. Blacks 48.7
Brown people are at the top and bottom of this list. Very few East Indian or Filipino fathers are not married, compared to half of blacks. Clearly, paternal commitment in the black community has collapsed. It survived Jim Crow just fine, but fell like a house of cards under liberalism. Puerto Rican men also have high rates of father absence. Chinese fathers are known for devotion to their children, but perhaps life in tradition-destroying cities like San Francisco have eroded this.
1. East Indians 95.5
2. Filipinos 94.4
3. French Canadians 90.0
4. Poles 82.1
5. English/Welsh 80.0
6. Dutch 74.5
7. Mexicans 74.4
8. Chinese 72.2
8. Scots 72.2
10. Irish 71.9
11. Italians 70.9
12. Germans 70.8
13. Norwegians 68.0
13. American Indians 68.0
15. French 65.4
16. Puerto Ricans 59.5
17. Blacks 48.7
Brown people are at the top and bottom of this list. Very few East Indian or Filipino fathers are not married, compared to half of blacks. Clearly, paternal commitment in the black community has collapsed. It survived Jim Crow just fine, but fell like a house of cards under liberalism. Puerto Rican men also have high rates of father absence. Chinese fathers are known for devotion to their children, but perhaps life in tradition-destroying cities like San Francisco have eroded this.
Thursday, June 29, 2006
Sunday, June 18, 2006
A sketch of American Muslims: How do Muslims compare with others in America? I haven't seen many systematic descriptions of this community. Here's some stats from the GSS:
Mean age
U.S. 45.3
Muslims 36.9
Percent male
U.S. 45.3 (females are more often home when interviewer visits)
Muslims 68.5
Percent black
U.S. 14.4
Muslim 37.0
Percent foreign-born
U.S. 9.3
Muslims 72.2
Percent not finishing high school
U.S. 14.6
Muslims 13.0
Percent with at least bachelor's
U.S. 24.9
Muslims 31.5
Percent unemployed
U.S. 5.1
Muslims 1.9
Occupational prestige
U.S. 43.6
Muslims 44.6
Conservative scale
U.S. 4.11
Muslims 3.69
"Does not value citizenship" scale
U.S. 1.40
Muslims 2.20
Average number of children
U.S. 1.96
Muslims 1.59
Church attendance scale
U.S. 3.89
Muslims 4.64
Compared to the general American population; Muslims are younger; more male; blacker; more likely to have been born in another country; and more likely to have a bachelor's degree or higher. They are less likely to be without a job; they have similar occupational success; they are more liberal (contrary to what some conservatives have said); they value citizenship less (like all immigrants); they have fewer children; and they are more religious.
So they look somewhat different from the overall population, but perhaps they are not much different from many other immigrant group, except for being more religious and have a greater number of blacks in their ranks. It might be a good idea for me to compare them with immigrants next, and to look more deeply into their politics and religious beliefs. Is there anything you want me to look for?
Mean age
U.S. 45.3
Muslims 36.9
Percent male
U.S. 45.3 (females are more often home when interviewer visits)
Muslims 68.5
Percent black
U.S. 14.4
Muslim 37.0
Percent foreign-born
U.S. 9.3
Muslims 72.2
Percent not finishing high school
U.S. 14.6
Muslims 13.0
Percent with at least bachelor's
U.S. 24.9
Muslims 31.5
Percent unemployed
U.S. 5.1
Muslims 1.9
Occupational prestige
U.S. 43.6
Muslims 44.6
Conservative scale
U.S. 4.11
Muslims 3.69
"Does not value citizenship" scale
U.S. 1.40
Muslims 2.20
Average number of children
U.S. 1.96
Muslims 1.59
Church attendance scale
U.S. 3.89
Muslims 4.64
Compared to the general American population; Muslims are younger; more male; blacker; more likely to have been born in another country; and more likely to have a bachelor's degree or higher. They are less likely to be without a job; they have similar occupational success; they are more liberal (contrary to what some conservatives have said); they value citizenship less (like all immigrants); they have fewer children; and they are more religious.
So they look somewhat different from the overall population, but perhaps they are not much different from many other immigrant group, except for being more religious and have a greater number of blacks in their ranks. It might be a good idea for me to compare them with immigrants next, and to look more deeply into their politics and religious beliefs. Is there anything you want me to look for?
Wednesday, June 14, 2006
"Moderate" often means apathetic: Moderates are often portrayed as responsible people, while strong conservatives or liberals are described as "extremists." In my experience, it is more accurate to divide people into two groups of "give a damn" and "don't give a damn." The GSS backs me up here. Respondents were asked how important politics and public life were to them, and answers ranged from 1 (unimportant) to 7 (very important). I calculated the average score for these groups:
Importance of politics
1. Extremely liberal 4.47
2. Conservative 4.34
3. Liberal 4.30
4. Extremely conservative 4.25
5. Slightly liberal 4.07
6. Slightly conservative 4.03
7. Moderate 4.03
Not only is politics relatively unimportant to moderates, they are less informed. Here is the percent who know who their U.S. Representative is:
Percent who know who U.S. Representative is:
1. Extremely conservative 91.7
2. Extremely liberal 88.9
3. Liberal 85.1
4. Slightly liberal 82.5
5. Conservative 80.9
6. Slightly conservative 80.3
7. Moderate 75.3
Importance of politics
1. Extremely liberal 4.47
2. Conservative 4.34
3. Liberal 4.30
4. Extremely conservative 4.25
5. Slightly liberal 4.07
6. Slightly conservative 4.03
7. Moderate 4.03
Not only is politics relatively unimportant to moderates, they are less informed. Here is the percent who know who their U.S. Representative is:
Percent who know who U.S. Representative is:
1. Extremely conservative 91.7
2. Extremely liberal 88.9
3. Liberal 85.1
4. Slightly liberal 82.5
5. Conservative 80.9
6. Slightly conservative 80.3
7. Moderate 75.3
Tuesday, June 13, 2006
Those Cheatin' Chinamen: As a follow-up to the last post, I calculated the percent of American men and women who have cheated on their spouse in the last year for various ethnic groups (from the GSS). First, you can see that the men are twice as likely as the women to stray--no surprise there. Men have higher rates in all ethnic groups except for Mexicans. But let's focus on comparing groups, not gender:
Percent of married men who cheated in the last year
1. Chinese 10.6
2. Blacks 9.8
3. Puerto Ricans 8.4
4. American Indians 7.9
5. Mexicans 5.9
U.S. average 4.5
6. Spain 4.5
6. Scots 4.5
8. Dutch 4.4
9. Filipinos 4.3
10. French 3.8
10. English/Welsh 3.8
12. Germans 3.7
13. Italians 3.3
14. Russians 3.2
15. Irish 2.9
15. Swedes 2.9
17. Czechs 2.2
18. French Canadians 1.5
So this basically stacks up as white vs. non-whites, with the non-whites having hig rates of infidelity. The exception to this is the Filipinos who fall below the national average. And I thought the Chinese were supposed to have low sex drives! But notice how none of the Chinese women cheated:
Percent of married women who cheated in the last year
1. Mexicans 7.6
2. Puerto Ricans 6.1
3. American Indians 4.1
4. Blacks 3.0
5. Irish 2.8
U.S. average 2.3
6. Italians 2.3
6. French 2.3
6. Germans 2.3
9. Filipinos 2.2
10. Spain 2.1
11. English/Welsh 1.5
12. Dutch 1.4
13. Russians 1.2
13. Scots 1.2
15. Swedes 0.0
15. Chinese 0.0
15. Czechs 0.0
15. French Canadians 0.0
Other men and women have similar rankings, but Chinese women are at the bottom while the men rank first. Filipinos are again below the average, and Irish women are above it, but otherwise we see the same pattern of more cheating among non-whites, less among whites. White racism must drive them to it.
Percent of married men who cheated in the last year
1. Chinese 10.6
2. Blacks 9.8
3. Puerto Ricans 8.4
4. American Indians 7.9
5. Mexicans 5.9
U.S. average 4.5
6. Spain 4.5
6. Scots 4.5
8. Dutch 4.4
9. Filipinos 4.3
10. French 3.8
10. English/Welsh 3.8
12. Germans 3.7
13. Italians 3.3
14. Russians 3.2
15. Irish 2.9
15. Swedes 2.9
17. Czechs 2.2
18. French Canadians 1.5
So this basically stacks up as white vs. non-whites, with the non-whites having hig rates of infidelity. The exception to this is the Filipinos who fall below the national average. And I thought the Chinese were supposed to have low sex drives! But notice how none of the Chinese women cheated:
Percent of married women who cheated in the last year
1. Mexicans 7.6
2. Puerto Ricans 6.1
3. American Indians 4.1
4. Blacks 3.0
5. Irish 2.8
U.S. average 2.3
6. Italians 2.3
6. French 2.3
6. Germans 2.3
9. Filipinos 2.2
10. Spain 2.1
11. English/Welsh 1.5
12. Dutch 1.4
13. Russians 1.2
13. Scots 1.2
15. Swedes 0.0
15. Chinese 0.0
15. Czechs 0.0
15. French Canadians 0.0
Other men and women have similar rankings, but Chinese women are at the bottom while the men rank first. Filipinos are again below the average, and Irish women are above it, but otherwise we see the same pattern of more cheating among non-whites, less among whites. White racism must drive them to it.
Monday, June 12, 2006
Mexicans are socially conservative, if you mean that men should have more than one woman--We social conservatives are told to celebrate the millions pouring in illegally from Mexico because they have the family values that Americans lack, right? According to the General Social Survey, 6.9% of Mexican Americans cheated on their spouse in the last year. This is more than double the rate for all Americans (3.3%). And you're wrong if you suspect this is just a male problem: 7.6% of Mexican women cheated. That's more than the men at 5.9%!
Sunday, June 11, 2006
Maybe crime doesn't have squat to do with lack of education
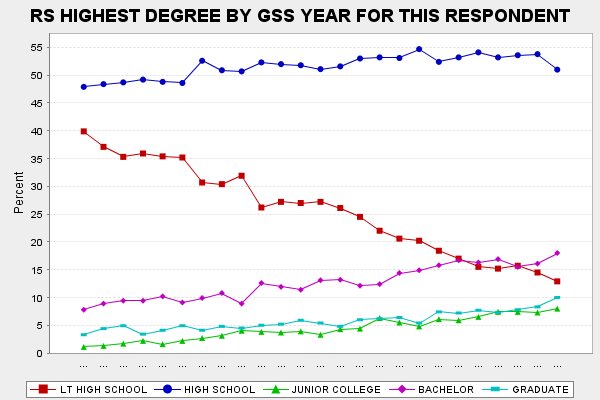
Have many times have you heard the liberal bromide that education is the key to the crime problem (and a host of other social ills)? I have always been skeptical of this idea, and it is one of those things experts always say and seem to think it is so obvious that nobody needs to bother to demonstrate it. I know the criminological research literature quite well, and the only thing I have seen documented is that kids who dislike school and perform poorly are considerably more likely to be delinquents. This tells us more about the kid than it does his education. In macrolevel research, eduational variables are often not included (which tells us they don't matter) and they don't seem to have much impact when you do actually see them analyzed. I'll guarantee you that, compared to percent graduated from high school, percent black is ten times the predictor of homicide rates.
The graph above (from the GSS) shows a large, steady decline in high school dropouts in the past 3 decades (look at the red line). While crime has been trending downward over the last decade or so, it was on the increase during the 70s and remained at a high level during the 80s. You might counter that we must focus on high risk groups, not the general population, but the overall trend was the same for young blacks, for example: the percent not finishing high school dropped from the 30s to the teens over this same period of time. And the sharpest drop was in the 1970s, the decade that saw more crime, not less.
Saturday, June 10, 2006
American Muslims are more against spanking than Jews: In my ongoing search to learn about American ethnic groups, I looked at the General Social Survey's question about favoring spanking as a form of discipline. Respondents' answers range from 1 (strongly agree) to 4(strongly disagree) so the higher the score, the more people dislike corporal punishment. Here are the rankings:
Mean anti-spanking score
1. Portuguese 2.50
2. Russians 2.39
3. Greeks 2.32
4. Indians 2.30
5. Filipinos 2.27
6. Swiss 2.26
6. Finns 2.26
8. Belgians 2.22
8. Lithuanians 2.22
10. Italians 2.21
11. French Canadians 2.20
12. Danes 2.19
13. Norwegians 2.18
14. Yugoslavs 2.13
14. Rumanians 2.13
16. Poles 2.11
16. Spain 2.11
18. Swedes 2.10
18. Irish 2.10
18. Hungarians 2.10
18. Austrians 2.10
22. French 2.09
22. Chinese 2.09
24. Puerto Ricans 2.07
24. Mexicans 2.07
26. English/Welsh 2.06
National average 2.05
27. Arabs 2.05
28. Czechs 2.04
28. Scots 2.04
30. Germans 2.03
31. Japanese 1.94
31. Dutch 1.94
33. American Indians 1.90
33. Blacks 1.75
35. West Indians 1.62
The tendencies: Americans from Eastern European and Scandanavian backgrounds don't like spanking, blacks and American Indians do. It surprises me that the Japanese like it, but the Italians do not.
I got curious about religion:
Muslim (not black) 2.68
Jewish 2.50
Hindu 2.31
Orthodox 2.30
No religion 2.25
Catholic 2.16
Buddhist 2.16
Protestant 1.91
Black Muslim 1.87
Big surprise--Muslims like spanking less than Jews! And I'm not surprised to see that my tradition--Protestantism--still likes to "whoop the tar out of 'em."
Mean anti-spanking score
1. Portuguese 2.50
2. Russians 2.39
3. Greeks 2.32
4. Indians 2.30
5. Filipinos 2.27
6. Swiss 2.26
6. Finns 2.26
8. Belgians 2.22
8. Lithuanians 2.22
10. Italians 2.21
11. French Canadians 2.20
12. Danes 2.19
13. Norwegians 2.18
14. Yugoslavs 2.13
14. Rumanians 2.13
16. Poles 2.11
16. Spain 2.11
18. Swedes 2.10
18. Irish 2.10
18. Hungarians 2.10
18. Austrians 2.10
22. French 2.09
22. Chinese 2.09
24. Puerto Ricans 2.07
24. Mexicans 2.07
26. English/Welsh 2.06
National average 2.05
27. Arabs 2.05
28. Czechs 2.04
28. Scots 2.04
30. Germans 2.03
31. Japanese 1.94
31. Dutch 1.94
33. American Indians 1.90
33. Blacks 1.75
35. West Indians 1.62
The tendencies: Americans from Eastern European and Scandanavian backgrounds don't like spanking, blacks and American Indians do. It surprises me that the Japanese like it, but the Italians do not.
I got curious about religion:
Muslim (not black) 2.68
Jewish 2.50
Hindu 2.31
Orthodox 2.30
No religion 2.25
Catholic 2.16
Buddhist 2.16
Protestant 1.91
Black Muslim 1.87
Big surprise--Muslims like spanking less than Jews! And I'm not surprised to see that my tradition--Protestantism--still likes to "whoop the tar out of 'em."
Friday, June 09, 2006
Noam Chomsky: I just watched Noam Chomsky on "Charlie Rose" and discovered he is exactly what the Left hates: he is an extreme genetic determinist. While I'm not as radical as all that, he provides me an excellent example of how to believe in genes and yet thrive in academia: just don't allow your beliefs about evolution have a whiff of influence on your thinking about anything, at least in the area of politics. Just convince yourself that genes are everything except that they are nothing. He has a knack for this kind of thinking: we need to shrink the government to nothing by first making it much, much bigger.
Thursday, June 08, 2006
In spite of all the noise about white wickedness, they are the best liked race: I looked at the General Social Survey to see how warmly people feel about various ethnic groups. Respondents were given a range of answers between very warm(1) and very cool(9). Here are the results:
Feelings toward blacks
Chinese 3.50
English/Welsh 3.66
Germans 3.69
Irish 3.58
Italians 3.34
Mexicans 3.67
Filipinos 4.38
American Indians 4.09
All white groups 3.64
All other races 3.78
Blacks 1.93
Feelings toward Hispanics
Blacks 3.53
Chinese 3.50
English/Welsh 3.75
Germans 3.73
Irish 3.72
Italians 3.31
American Indians 4.21
All white groups 3.63
Mexicans 2.05
Feelings toward Asians
Blacks 3.61
English/Welsh 3.82
Germans 3.78
Irish 3.78
Italians 3.64
Mexicans 3.48
American Indians 4.33
All groups 3.69
Chinese 2.79
Feelings toward whites
Blacks 3.36
Chinese 3.21
Mexicans 2.77
American Indians 3.49
West Indians 4.00
Whites 2.78
Okay, there is a lot here. I included a variety of larger ethnic groups and other groups if they had a particular dislike for the ethnic group in question. Blacks, Hispanics, and Asians have similar overall scores, indicating that these groups are equally less popular than whites. (I will say that Asians, surprisingly, might be the least liked of the groups). Only one group expressed coolness toward whites--West Indians.
Of all ethnic groups, American Indians liked other groups the least. Blacks and Hispanics liked themselves the most--whites and Chinese liked themselves the least. But more precisely, Chinese rated Asians, not just other Chinese, so it is likely that, while various ethnic groups like whites the best, they like themselves the least. In fact, Mexicans like whites as much as whites like themselves.
Feelings toward blacks
Chinese 3.50
English/Welsh 3.66
Germans 3.69
Irish 3.58
Italians 3.34
Mexicans 3.67
Filipinos 4.38
American Indians 4.09
All white groups 3.64
All other races 3.78
Blacks 1.93
Feelings toward Hispanics
Blacks 3.53
Chinese 3.50
English/Welsh 3.75
Germans 3.73
Irish 3.72
Italians 3.31
American Indians 4.21
All white groups 3.63
Mexicans 2.05
Feelings toward Asians
Blacks 3.61
English/Welsh 3.82
Germans 3.78
Irish 3.78
Italians 3.64
Mexicans 3.48
American Indians 4.33
All groups 3.69
Chinese 2.79
Feelings toward whites
Blacks 3.36
Chinese 3.21
Mexicans 2.77
American Indians 3.49
West Indians 4.00
Whites 2.78
Okay, there is a lot here. I included a variety of larger ethnic groups and other groups if they had a particular dislike for the ethnic group in question. Blacks, Hispanics, and Asians have similar overall scores, indicating that these groups are equally less popular than whites. (I will say that Asians, surprisingly, might be the least liked of the groups). Only one group expressed coolness toward whites--West Indians.
Of all ethnic groups, American Indians liked other groups the least. Blacks and Hispanics liked themselves the most--whites and Chinese liked themselves the least. But more precisely, Chinese rated Asians, not just other Chinese, so it is likely that, while various ethnic groups like whites the best, they like themselves the least. In fact, Mexicans like whites as much as whites like themselves.
Is religion impotent? Nobody likes the idea better than I do that belonging to a religion influences attitudes and behavior (usually for the better), but the case of the Catholic church (which I also like very much) provides little evidence for this. You would expect Catholics to oppose abortion, condom use, and capital punishment, and to have more children than other Americans. Let's compare them to Protestants:
Percent in favor of abortion on demand
Protestants 36.1%
Catholics 35.4
(Jews 78.4!)
Percent in favor of death penalty
Protestants 74.0%
Catholics 74.7
Percent using condom last time one had sex
Protestants 18.6%
Catholics 22.0
Average number of children
Protestants 2.04
Catholics 2.08
Evidently, all that doctrine and preaching and enculturation of the youth has precisely zero impact on adherents. You might say that we see no impact because Catholics never go to church and never learn this stuff, but according to the GSS, 36% go at least once a week. Thank God religion gives people meaning, or from a practical, earthly stance, what would be the point of it?
Percent in favor of abortion on demand
Protestants 36.1%
Catholics 35.4
(Jews 78.4!)
Percent in favor of death penalty
Protestants 74.0%
Catholics 74.7
Percent using condom last time one had sex
Protestants 18.6%
Catholics 22.0
Average number of children
Protestants 2.04
Catholics 2.08
Evidently, all that doctrine and preaching and enculturation of the youth has precisely zero impact on adherents. You might say that we see no impact because Catholics never go to church and never learn this stuff, but according to the GSS, 36% go at least once a week. Thank God religion gives people meaning, or from a practical, earthly stance, what would be the point of it?
Tuesday, June 06, 2006
Are gays really sad? Being denied the ability to marry, are gays unhappy (and s0 perhaps should be called "sads" instead)? According to the GSS, these are the percentages of unhappy people:
straight men 9.1%
gay men 9.9
bisexual men 23.1
straight women 10.1%
lesbians 13.1
bisexual women 15.9
Gay men are the second happiest group, behind hetero men. What guy wouldn't be happy to get non-committal sex whenever he wanted it? As we saw in an earlier post, it's the bisexuals who are troubled. Perhaps we should legalize bisexual marriage. If we did, it would have to be a union of two men and two women so each partner has a partner of each sex. Or it could be three if some partners were hetero. Or if some partners were gay. But now I'm confusing myself. But anyway, for me to be fulfilled, I'd say my nature requires, hmmm, 3 wives: one new young wife each decade until I'm too old to care.
straight men 9.1%
gay men 9.9
bisexual men 23.1
straight women 10.1%
lesbians 13.1
bisexual women 15.9
Gay men are the second happiest group, behind hetero men. What guy wouldn't be happy to get non-committal sex whenever he wanted it? As we saw in an earlier post, it's the bisexuals who are troubled. Perhaps we should legalize bisexual marriage. If we did, it would have to be a union of two men and two women so each partner has a partner of each sex. Or it could be three if some partners were hetero. Or if some partners were gay. But now I'm confusing myself. But anyway, for me to be fulfilled, I'd say my nature requires, hmmm, 3 wives: one new young wife each decade until I'm too old to care.
Chinese Americans like the death penalty--blacks do not: According to the General Social Survey, almost 9 out of 10 Americans of Chinese ancestry favor the capital punishment. A clear majority in all ethnic groups feel the same way, except for blacks and West Indians:
1. Chinese 86.5%
2. Rumanians 82.6
3. Yugoslavs 81.2
4. Czechs 81.1
5. Greeks 80.8
6. Hungarians 80.6
7. Germans 79.8
8. Poles 79.4
8. English/Wales 79.4
10. Scots 79.7
11. French Canadians 79.2
12. Italians 78.3
13. Netherlands 77.3
14. Swedes 76.8
15. French 76.1
16. Belgians 76.0
17. Austrians 75.9
18. Danes 75.8
19. Irish 75.0
20. Japanese 74.4
U.S. average 73.6
21. Arabic 73.2
22. Swiss 72.9
22. Lithuanians 72.9
24. Norwegians 72.8
25. American Indians 71.9
25. Mexicans 71.9
27. Jews 71.7
28. Russians 70.8
29. Finns 70.7
30. India 70.4
31. Spain 69.6
32. Portugal 69.1
33. Filipinos 65.1
34. Puerto Ricans 60.5
35. Blacks 49.2
36. West Indians 47.8
Looking for patterns, Eastern Europeans are generally pro-death penalty, while poor minority groups are at the bottom of the list. We saw in the previous post that these groups are most willing to keep pot illegal, suggesting as Agnostic wrote, that these groups are more authoritarian. A dislike for capital punishment may reflect the view that it is imposed in a racially biased way. (It is not: the disproportionate number of minorities on death row is due to high rates of robbery-murders committed by these groups--the type of murder that qualifies as a capital crime). It is interesting that Arabs are average. I am getting the impression from GSS data that Arabs in America are surprisingly assimilated.
1. Chinese 86.5%
2. Rumanians 82.6
3. Yugoslavs 81.2
4. Czechs 81.1
5. Greeks 80.8
6. Hungarians 80.6
7. Germans 79.8
8. Poles 79.4
8. English/Wales 79.4
10. Scots 79.7
11. French Canadians 79.2
12. Italians 78.3
13. Netherlands 77.3
14. Swedes 76.8
15. French 76.1
16. Belgians 76.0
17. Austrians 75.9
18. Danes 75.8
19. Irish 75.0
20. Japanese 74.4
U.S. average 73.6
21. Arabic 73.2
22. Swiss 72.9
22. Lithuanians 72.9
24. Norwegians 72.8
25. American Indians 71.9
25. Mexicans 71.9
27. Jews 71.7
28. Russians 70.8
29. Finns 70.7
30. India 70.4
31. Spain 69.6
32. Portugal 69.1
33. Filipinos 65.1
34. Puerto Ricans 60.5
35. Blacks 49.2
36. West Indians 47.8
Looking for patterns, Eastern Europeans are generally pro-death penalty, while poor minority groups are at the bottom of the list. We saw in the previous post that these groups are most willing to keep pot illegal, suggesting as Agnostic wrote, that these groups are more authoritarian. A dislike for capital punishment may reflect the view that it is imposed in a racially biased way. (It is not: the disproportionate number of minorities on death row is due to high rates of robbery-murders committed by these groups--the type of murder that qualifies as a capital crime). It is interesting that Arabs are average. I am getting the impression from GSS data that Arabs in America are surprisingly assimilated.
Monday, June 05, 2006
Who favors making marijuana legal? Some readers have suggested that being in favor of legalizing MJ is a conservative position. It certainly is a libertarian one, but let's look and see what kind of people believe this way. Let's begin with political orientation:
Percent in favor of MJ legalization
Extremely liberal 64.2%
Extremely conservative 19.2
Sociologically speaking, it is clearly a liberal position. But I wanted to make a sketch of the pro-legalization camp. Here's a list:
U.S. total in favor: 34.8%
18-30 year-olds 43.4
Graduate degree 44.3
Never attends church 52.7
Pacific region 42.9
Russian ethnic group 50.0
And poor minority groups were most against it:
Blacks 26.3%
Mexicans 25.9
Puerto Ricans 23.7
So the GSS indicates that the people who want marijuana to be legalized the most are young, educated, secular whites, especially those who are very liberal. By contrast, three-quarters of people from poor, less educated minority groups are against it. Perhaps they have seen the costs of abuse most closely, or are more comfortable with criminalizing undesirable behaviors.
Percent in favor of MJ legalization
Extremely liberal 64.2%
Extremely conservative 19.2
Sociologically speaking, it is clearly a liberal position. But I wanted to make a sketch of the pro-legalization camp. Here's a list:
U.S. total in favor: 34.8%
18-30 year-olds 43.4
Graduate degree 44.3
Never attends church 52.7
Pacific region 42.9
Russian ethnic group 50.0
And poor minority groups were most against it:
Blacks 26.3%
Mexicans 25.9
Puerto Ricans 23.7
So the GSS indicates that the people who want marijuana to be legalized the most are young, educated, secular whites, especially those who are very liberal. By contrast, three-quarters of people from poor, less educated minority groups are against it. Perhaps they have seen the costs of abuse most closely, or are more comfortable with criminalizing undesirable behaviors.
Sunday, June 04, 2006
More people say they are conservative, but want more spending


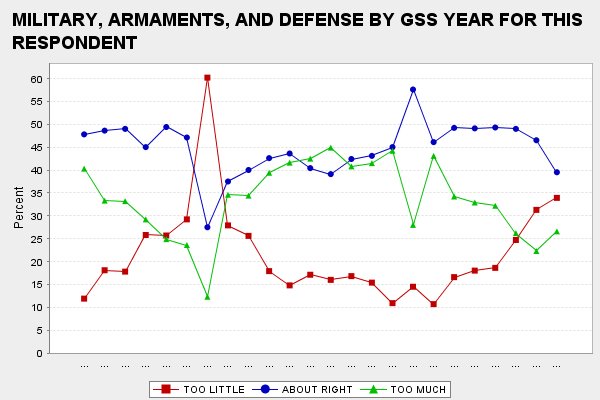
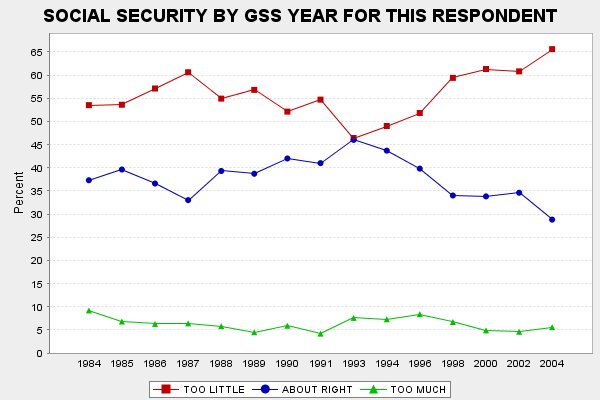

A reader suggested that I analyze in more detail the trends in politcal views. The graphs above display the issues where there have been noticeable changes. (The red line represents people who feel were are not spending enough--in the case of marijuana, it is the percent in favor of legalization). With only one issue--military spending--do we see a conservative trend. Republicans have benefitted from the post-9/11 concern over security, but it is interesting that the pro-military trend started in the late 1990s.
More people feel we are not spending enough on education, health, and social security. So how is it that more people are also calling themselves conservative? Perhaps it has come to be associated with a tough-minded person as opposed to the unappealing image of the kooky liberal, or as a reader wrote, perhaps people equate "conservative" with "Republican," and nowadays being a Republican and being in favor of spending is not seen as incompatabile.
I have heard people say that the country is split into thirds: liberals, moderates, and conservatives. This is inaccurate:
Liberals 24.4%
Moderates 38.0
Conservatives 37.6
One the one hand, 75% of the country says it is not liberal, and there are as many conservatives as moderates, but on the other hand, conservative seems increasingly to mean "liberal (pro-spending) but not crazy." Of course, no one says they want to be taxed more: exactly 1.5% say we don't get taxed enough.
Saturday, June 03, 2006
Andrew Sullivan knows less about how people feel about homosexuality than I do (and I'm nobody and straight and don't care): In recent debate that included Pat Buchanan, Andrew Sullivan said that the culture war that Pat talks about exists only among the Baby Boomers--generation Xers have all agreed that abortion and gay marriage are just fine. Well, Andy needs to broaden his circle (how big can the gay neo-con circle be?).
Here's a comparison of Boomers and Xers on the percent who believe in abortion on demand and who feel that homosexuality is not wrong:
Abortion on demand
Boomers 47.1%
Xers 35.5
Homosexuality okay
Boomers 35.5%
Xers 32.1
Xers are more conservative, not less, on these key cultural issues, and they are obviously just as divided as Boomers. It's humorous just how often pundits are full of it.
Here's a comparison of Boomers and Xers on the percent who believe in abortion on demand and who feel that homosexuality is not wrong:
Abortion on demand
Boomers 47.1%
Xers 35.5
Homosexuality okay
Boomers 35.5%
Xers 32.1
Xers are more conservative, not less, on these key cultural issues, and they are obviously just as divided as Boomers. It's humorous just how often pundits are full of it.
In the past few decades, have Americans moved right? Berkeley political scientist Paul Pierson has written that the Republican Party has moved sharply right in the last three decades and has been very successful in spite of the fact that the American public has not moved right at all during the same period. (He argues that they have been so successful because they are more cunning and unified than Democrats, and their going against the public's will has undermined democracy). But is this core claim of his true that Americans have not shifted? Since 1974 the GSS has asked respondents to describe themselves on a range between extremely liberal and extremely conservative. I calculated the mean score for all the years available from 1974 to 2004. Here are the numbers for each decade (4=moderate and higher numbers are more conservative):
1974: 3.98
1984: 4.17
1994: 4.17
2004: 4.23
And the trend is stronger when we only look at the people who actually vote:
1974: 3.97
1984: 4.22
1994: 4.19
2004: 4.34
So Pierson is wrong, they have gotten more conservative. On the one hand, the move to the right has only been 1/3 of a standard deviation, but in politics even small shifts can swing elections.
1974: 3.98
1984: 4.17
1994: 4.17
2004: 4.23
And the trend is stronger when we only look at the people who actually vote:
1974: 3.97
1984: 4.22
1994: 4.19
2004: 4.34
So Pierson is wrong, they have gotten more conservative. On the one hand, the move to the right has only been 1/3 of a standard deviation, but in politics even small shifts can swing elections.
Extremely liberal atheists are most likely to think there is nothing wrong with teenage sex: A reader suggested I identify that very small group of Americans (2.7%) who think that sex between teens ages 14 to 16 is not wrong. I looked at just about anything I could think of and found that the following groups were most accepting: men, blacks, and especially people who do not believe in God, or who are extremely liberal. Examining all factors together produces very small cell sizes, so if we only look at the two strongest predictors--extremely liberal atheists--the percent who think teen sex is okay is 36.4%.
Friday, June 02, 2006
Black male college students have a sinister view of the world: I've noticed something very interesting in the classroom with black guys (at least the vocal ones). They are uniformly drawn to sinister views of the way the world works. All people are on the take. There isn't an honest person on the entire planet. Human motivation is universally greedy and exploitative. Conspiracy theories are the true ones. Jews have too much influence. Corruption is everywhere, and so you can hardly blame someone for unethical behavior. This doesn't appear to be the result of what is learned in class because there is no pattern of this among other students who take basically the same classes (most of my students are social science majors). I don't see the same pattern among black females. And in my experience, this is not just a noticeable tendency: no talkative black guy has ever communicated a different view.
Subscribe to:
Posts (Atom)
Are gun owners mentally ill?
Some anti-gun people think owning a gun is a sign of some kind of mental abnormality. According to General Social Survey data, gun owners ...

-
 In the comments in the last post , some readers contended that Jews are not ethnocentric. Using the same question I used in the comments se...
 -
Via a reader at iSteve, it looks like this might be the vocabulary test used by the General Social Survey. (Someone please tell me if I'...
-
I've been distributing a questionnaire to students which, among other things, asks them their religion. Quite a few have answered "...