In his wonderful political novel The Possessed, Fyodor Dostoevsky wrote that socialists obsess about their own money more than anyone. Anecdotally, the flaming lesbian socialist professor whose office is next to mine is constantly on the phone with someone talking about her investments. (I can see why she worries. She has a lot more money than the rest of us. Her salary is 20 percent higher than any faculty I know.)
The General Social Survey asked respondents who is in charge of family finances (sample size = 208). This might not be the perfect measure of concern for money, but it's the best one I could find.
Twelve percent of liberals compared to 24 percent of conservatives said their spouse takes care of the money. (Gender is not a factor. Also--most couples share the responsibility.) So, by this measure, twice as many conservatives don't focus on money.
Thursday, December 29, 2011
Wednesday, December 28, 2011
Coulter on the best illegal immigration candidate
Merry Christmas to me when mainstream pundits start sounding like us race realists. From Ann Coulter:
By the way, Ann goes on to conclude that Bachmann and Romney are the best on illegal immigration, but that only Romney can win.
In the upcoming presidential election, two issues are more important than any others: repealing Obamacare and halting illegal immigration. If we fail at either one, the country will be changed permanently.
Taxes can be raised and lowered. Regulations can be removed (though they rarely are). Attorneys general and Cabinet members can be fired. Laws can be repealed. Even Supreme Court justices eventually die.
But capitulate on illegal immigration, and the entire country will have the electorate of California. There will be no turning back.
By the way, Ann goes on to conclude that Bachmann and Romney are the best on illegal immigration, but that only Romney can win.
Tuesday, December 27, 2011
Racial differences in felony sentences
Using various sources (NCVS, UCR, BJS), I put together three tables which help explain why state prisoners are roughly half black even though African Americans are only 13 percent of the U.S. population. The disparity is divided into differences in commtting serious violent crimes (i.e., robbery, aggravated assault, and rape/sexual assault), differences in the chance of arrest, and differences in the probability of conviction. (One limitation is that government statisticians are idiots and lump Hispanics in with whites, so "whites in the following table actually means "whites plus Hispanics.")

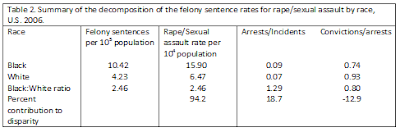


For all three types of violent crime, most of the racial disparity is due to blacks committing crimes at much higher rates. You might think this is obvious, but many liberals think the gap is due to a racist criminal justice system. Some of the difference in convictions is due to a greater black risk, given a crime, of being arrested. Some of this might be due to lower average black intelligence which leads to riskier crimes.
Finally, little or none of the racial gap is due to blacks being more likely to be convicted of a felony (which is likely to land one in prison for at least a year). In fact, given an arrest for rape, a white man is more likely to be convicted than a black man. This might be, in part, due to less willingness of African American jurors to put a fellow black behind bars for a crime that can be difficult to prove. Or perhaps victims of black offenders--often black themselves--tend to be less reliable.
Overall, if liberals are bothered by the racial disparity in prison (myself, I care about punishing bad guys), the data suggests that they should focus on black criminality, not the system.
Monday, December 26, 2011
Study: Sex differences in brain volume are related to specific skills, not to general intelligence
A new study in the journal Intelligence of 100 Spaniard male and female college students reports that men, on average, have more total brain volume (TBV) and more gray matter volume (GMV), but these do not translate into higher general intelligence (g). Sex differences only appear for specific mental abilities. TBV and GMV are positively correlated with greater visuospatial skills (i.e., mental rotation). By contrast, higher specific verbal skills are associated with lower: 1) visuospatial skills, 2) total brain volume, and 3) white matter volume. From these results, the researchers conclude that larger male brains provide more total neurons needed for mental manipulation of 3D objects, while smaller female brains might work more efficiently to give enhanced verbal skills (that are unrelated to g).
Friday, December 23, 2011
Charlton's Thought Prison
Do yourself a favor and read Thought Prison: The Fundamental Nature of Political Correctness--a new book written by the distinguished scholar (and reader of this blog) Dr. Bruce Charlton. I've read 500-page books before (e.g., Interpretation of Dreams) that taught me very little, but Dr. Charlton's 2-hour book might change your worldview. If asked, many people might say that the most serious problem facing the West today is economic, but Thought Prison makes the compelling case that the ideology of political correctness will eventually destroy us. According to Charlton, there is a small chance that we can beat it with a populist Right movement, but the more realistic response is personal defiance. What does he mean by this? I'm not going to give the whole thing away. Read the book and find out. Then comment here if you feel like it.
Thursday, December 22, 2011
Homosexual voting over the past three decades
Have homosexuals moved left over time? According to the GSS, it looks like they have. Shown below are the percent (of all gay men, bisexuals, and lesbians) who voted for the Democrat in the presidential election:
Percent who voted for the Democrat
Obama 88
Kerry 73
Gore 66
Clinton 75
Clinton 62
Dukakis 63
Mondale 57
The Democrat share rose from 57 percent in 1984 to 88 percent in 2008. It looks like the culture war may have pushed non-heteros to the left (although they started this period somewhat to the left anyway) .
Sunday, December 18, 2011
Characteristics of smart people who don't go to college
In the comments section of the last post, reader SFG wonders about the characteristics of people who are smart but who do not go to college.
Using GSS data, I created a two-category variable where people with eight through ten out of ten questions correct on a vocabulary quiz but who never went to college are assigned a one, and everyone else is given a zero. Those in the first category make up about 11 percent of the total adult population surveyed over the past 40 years.
Next, I chose eight variables as predictors. Here are the logistic regression coefficients (sample size = 16,215):
Logistic Regression Coefficients
Year -.02
Age .02
Sex .42
Race 1.45
Father's education .03
Church attendance -.04
Political conservatism .01
Number of offspring -.03
All of the predictors are significantly related to the outcome variable except for political conservatism. So what is the profile of someone who is smart but went no further than high school? I'll attempt to list factors from most powerful to least: older, white, being surveyed in earlier years, female, having an educated father, going to church less often, and having fewer children.
I also compared the mean incomes of the two categories. The smart group that didn't go to college made about $1,000 more a year than the average for the other group.
Many of the factors make sense. Older people from earlier cohorts were less likely to go to college, even if they were intelligent. The same for women. Blacks are much less likely to be bright people who fail to attend college. Having a successful father can sometimes open a good career path that requires no higher education. Perhaps irreligiosity indicates unconventionality. Political attitudes appear to have no effect on choosing to avoid college.
Tuesday, December 13, 2011
IQ and spanking
GSS respondents were asked: "Do you strongly agree, agree, disagree, or strongly disagree that it is sometimes necessary to discipline a child with a good, hard spanking?" I assigned the following scores to answers: strongly agree (4), agree (3), disagree (2), and strongly disagree (1):
Mean spanking scores (sample size = 13,506)
Smart group 2.71
Mediocre group 2.98*
Dull group 3.05*
*significantly higher than smart group
There is a four-tenths of a standard deviation between the smart and dull group--a medium-size gap. It is not clear to me that the view that spanking is never necessary is the rational one. Smart people do seem to be leading the charge against strict discipline.
Monday, December 12, 2011
Scientists, artists, and empathy
In The Science of Evil, Simon Baron-Cohen reports research that found that artists are more empathetic than scientists and engineers. I replicated this with GSS data. Respondents were asked how well does the following statement describe them: "Sometimes I don't feel very sorry for other people when they are having problems." Answers ranged from "does not describe very well" (1) to "describes very well" (5). I reverse-scored the answers so that high numbers reflect high empathy. Here are the means (sample size = 124):
Mean empathy score
Scientists/Engineers 3.34
Writers/Actors/Painters/Dancers/Musicians 3.77
This is four-tenths of a standard deviation difference--a medium-size gap--but it is not statistically significant.
Mean empathy score
Scientists/Engineers 3.34
Writers/Actors/Painters/Dancers/Musicians 3.77
This is four-tenths of a standard deviation difference--a medium-size gap--but it is not statistically significant.
Friday, December 09, 2011
Skin color and occupational prestige among blacks
As a follow-up to the last post, I looked to see if skin color among blacks is related to occupational prestige. Interviewers rated skin color from very dark brown to very light brown. Here are the mean prestige scores (GSS data, sample size = 454):
Mean occupational prestige scores
Very dark brown 28.3
Dark brown 28.4
Medium brown 35.3*
Light brown 33.2
Very light brown 42.7*
*significantly higher than the very dark brown group
Lighter groups tend to have better jobs than darker groups. This is consistent with the common observation that elite blacks often look like they have more European ancestry.
Tuesday, December 06, 2011
Skin color and desirable traits
Donald Templer and J. Phillippe Rushton have recently published a study of the 50 U.S. states which finds strong correlations among the following varaibles: skin color, IQ, infant mortality, life expectancy, violent crime, HIV/AIDS, and income. This pattern mirrors what Templer has observed internatioanlly. Skin color tends to be more strongly correlated to the list of variables than does income, so the authors conclude that this points to biology rather than economic environment as the more important explanation of the pattern of correlations. They rely on Rushton's life history theory and Lynn's cold climate theory to make sense of why the variables hang together, but whatever the explanation, there seems to be a worldwide pattern of desirable (or undesirable traits) running together, and this is closely associated with skin color.
They review some interesting research by Ducrest et al. (2008) which found that in 20 wild vertebrate species, darker individuals are more aggressive, sexually active, and resistant to stress. They also tend to have a larger body mass and greater energy and physical activity. For example, darker maned male lions are reported to be more aggressive and sexually more active, and darker barn owls show stronger immune response. Darker coloration is associated with enhanced fertility, female sexual receptivity, male sexual motivation and performance, and higher levels of testosterone. Ducrest et al., however, cautioned that these findings might not apply to humans.
They review some interesting research by Ducrest et al. (2008) which found that in 20 wild vertebrate species, darker individuals are more aggressive, sexually active, and resistant to stress. They also tend to have a larger body mass and greater energy and physical activity. For example, darker maned male lions are reported to be more aggressive and sexually more active, and darker barn owls show stronger immune response. Darker coloration is associated with enhanced fertility, female sexual receptivity, male sexual motivation and performance, and higher levels of testosterone. Ducrest et al., however, cautioned that these findings might not apply to humans.
Friday, December 02, 2011
I love American elites
Zbigniew Brzezinski said on Morning Joe this morning that the U.S. is the most socially unjust country in the world because our GINI coefficient is the highest in the world. He's close: We are 40th.
I love American elites. They import tens of millions of poor immigrants over the years and then point and say, "The U.S. is evil because it's so unequal!"
I love American elites. They import tens of millions of poor immigrants over the years and then point and say, "The U.S. is evil because it's so unequal!"
Rootedness of illegal aliens

Newt Gingrich says we shouldn't deport illegals who have roots here. The Pew pie chart shows that only 15 percent of illegal aliens have been here less than 5 years. According to the lower graph, 46 percent have minor children here in the country. By Newt's standard, few of the ten million (Pew's estimate) should be sent home. (I love the term "unauthorized immigrant." That's like calling a burglar an "unapproved entrant.")

Monday, November 28, 2011
Predictors of wanting porn to be illegal
GSS participants were asked if they thought that porn should be illegal. I looked to see which characteristics predict answering yes (sample size = 12,246):
Logistic Regression Coefficients
Age .03
Sex .81
Educ -.04
IQ -.01
Income -.01
Church attendance .19
Conservatism .21
Year -.01
All the relationships are statistically significant at the 95 percent confidence level (two-tailed test). Making porn illegal is favored by people who are: older, female, less educated, less intelligent, poorer, more religious, and more conservative. In addition, support for getting rid of the stuff has dropped over the past 40 years.
The coefficients are not standardized, so don't try to estimate the strength of a relationship from the numbers. Actually, it looks like the most powerful predictors are: age, religiosity, sex, and conservatism, in that order. I was surprised to see that almost half of women support banning pornography, and this number has changed little in 40 years.
Dana Carvey was on to something with his SNL "Church Lady." Funny stuff, but call me crazy: I respect old religious women.
Saturday, November 26, 2011
Height and family size
A study reported by the BBC (H/T Jason Malloy) found that, contrary to expectations, tall men do not have the most children. Men of average height do.
I replicated the study with MIDUS data on 2,316 white men, and found the following:
Mean number of children
Tall men 2.43
Average men 2.57
Short men 2.46
The results are similar to the study's (the numbers are high because stepchildren and adopted children are included). The difference is attributed to average men marrying earlier. The thinking seems to be that taller men hold out longer before getting married--because of greater attractiveness--and end up marrying women who are also older and who have fewer married years in which to have children.
Friday, November 25, 2011
Which major has the smartest students?
Using GSS data, I calculated the mean IQ for people who graduated with degrees in popular majors (sample = 855)
Mean IQ
English 112.0
History 111.3
Law 110.1
Art 110.0
Political Science 107.9
Biology 107.1
General Sciences 106.6
Education 106.1
Communications 105.9
Math 105.6
Finance 105.4
Psychology 105.2
Marketing 105.0
Overall average 104.3
Liberal Arts 104.0
Engineering 103.8
Law Enforcement 103.8
Social Work 103.6
Business Administration 102.4
Computer Science 102.2
Health 101.9
Accounting 101.7
Nursing 101.3
General Studies 101.1
Keep in mind that IQ is measured with a vocabulary test which favors verbal intelligence. Notice how the smartest students tend to major in the least practical fields.
I divided majors into practical and not practical, and found a difference:
Mean IQ
Not practical 106.5
Practical 103.4
Smart people tend to choose majors which are least likely to translate into a job. This is another indication of how smart people are not necessarily the most rational.
Mean IQ
English 112.0
History 111.3
Law 110.1
Art 110.0
Political Science 107.9
Biology 107.1
General Sciences 106.6
Education 106.1
Communications 105.9
Math 105.6
Finance 105.4
Psychology 105.2
Marketing 105.0
Overall average 104.3
Liberal Arts 104.0
Engineering 103.8
Law Enforcement 103.8
Social Work 103.6
Business Administration 102.4
Computer Science 102.2
Health 101.9
Accounting 101.7
Nursing 101.3
General Studies 101.1
Keep in mind that IQ is measured with a vocabulary test which favors verbal intelligence. Notice how the smartest students tend to major in the least practical fields.
I divided majors into practical and not practical, and found a difference:
Mean IQ
Not practical 106.5
Practical 103.4
Smart people tend to choose majors which are least likely to translate into a job. This is another indication of how smart people are not necessarily the most rational.
Monday, November 21, 2011
Regional traditionalism and marriage among black men
Blacks seem to do a little better in more conservative regions.
Using GSS data for the nine U.S. regions, I calculated the Pearson correlations between: 1) the percent of black men who are married, 2) the mean level of church attendance (for all races), and 3) the mean level of political conservatism (for all races).
All correlations are positive and very strong: percent married/church attendance, .84; and percent married/political conservatism, .66. (While we're at it, the correlation between attendance and conservatism across the nine regions is .89. Religiosity and conservatism are, empirically, practically the same thing.)
Thursday, November 17, 2011
Hispanics are now the face of American poverty

This graph from Pew shows that if the poverty rate is adjusted for such items as medical expenses, tax credits, and non-cash government benefits, Hispanics become the poorest large group of Americans. Over the past 45 years, we have imported a population which is now bigger and poorer than the black community. Our worst enemies could never have done this to us.
Sunday, November 13, 2011
On the measurement of energy
Steve Sailer says, "It's unfortunate that social scientists don't seem to have a reliable quick test of energy the way they have tests of intelligence, since it's obvious that energy differs widely among individuals and is important in influencing life outcomes."
The GSS has asked participants the following: "How much of the time during the past 4 weeks did you have a lot of energy?" Turns out, the answers are roughly normally distributed (sample size = 1,409):
Percent having a lot of energy over the past month
All the time 10.4
Most of the time 34.5
A good bit of time 22.6
Some of the time 18.4
A little biit of the time 9.5
None of the time 4.6
And here are the correlations with several variables:
Age -.18
Education .12
Income .15
Occupational prestige .05
As expected, energy decreases with age, and is associated with more education and income. (The correlation with occupational prestige is trivial).
These findings provide evidence that this single item is not an invalid measure of energy. The correlations are small, but I would expect just that, given that we are measuring a trait at one moment in time that has exerted its influence over a lifetime. Add to that the fact that energy level is probably not as stable over time as, say, IQ.
Like Steve, I see energy making a big difference. I would be a much more accomplished person if I had the energy. Reading my blog, you might think I have a preference for brevity. Truth is, I'm too lazy to write more. I'd like to do the research to find out how to boost my drive, but it makes me tired even to contemplate it. I'll lie down and let the impulse pass.
-
Friday, November 11, 2011
Thursday, November 10, 2011
Wednesday, November 09, 2011
Growing up Mormon and marital infidelity
Here are the percentages of Americans who have cheated on their spouse listed by whether or not you grew up as a Mormon (sample size = 1,104):
Percent ever cheating on spouse
Grew up Mormon 4.5
Everyone else 17.6
The difference is not statistically significant because there are only 44 people in the sample who grew up Mormon.
Percent ever cheating on spouse
Grew up Mormon 4.5
Everyone else 17.6
The difference is not statistically significant because there are only 44 people in the sample who grew up Mormon.
Monday, November 07, 2011
Race and sexual harassment
The Cain sexual harassment scandal makes me wish I had good survey data in order to look, for example, at whether there are racial differences. The Longitudinal Study of Violence Against Women did ask male college students if they have ever used their authority (as boss, teacher, camp counselor, supervisor, etc.) to get a female to engage in unwanted: 1) sexual activities short of intercourse, and 2) intercourse. Here are the percentages of men who answered yes (sample size = 821):
Percent using authority for sex play
Whites 2.3
Blacks 1.4
Others 4.2
Percent using authority for intercourse
Whites 3.0
Blacks 2.8
Others 6.2
None of the differences are significantly different due to the rarity of sexual harassment. Keep in mind that blacks and others (who are mostly Hispanic) are less likely to have positions of authority so their rates would probably be higher if they equaled whites in leadership positions. Plus, validity research has shown that black males are less willing than whites to admit to deviant behavior.
Study: Flynn effect is not caused by hybrid vigor
From Psychological Review:
Mingroni (see record2007-10421-011 ) proposed that heterosis or hybrid vigor may be the principal driver of the Flynn effect—the tendency for IQ scores to increase at a rate of approximately 3 points per decade. This model was presented as a resolution to the IQ paradox—the observation that IQ scores have been increasing despite their high adult heritability—on the basis that substantial changes in IQ can only be accounted for by changes in underlying genetic factors. It is here argued that this model is predicated upon a misconception of the Flynn effect, which is most pronounced on the least g-loaded components of cognitive ability tests and is uncorrelated with genetic effects such as inbreeding depression scores (which are correlated with the g loadings of tests). Evidence supportive of the recently proposed life history model of the Flynn effect is presented. In the discussion, other theoretical objections to the heterosis model are also considered. On this basis, it is concluded that the Flynn effect is strongly entwined with developmental status and that heterosis cannot be its principal cause.
Sunday, November 06, 2011
Social class, camping, and fundamentalism
Do lower status whites enjoy nature? GSS respondents were asked if they've gone camping in the past year. Based on occupational prestige scores, I constructed 4 classes: lower, working, middle, and upper.
Percent who camp
Lower 41.6 (n = 269)
Working 46.5 (n = 376)
Middle 46.6 (n = 397)
Upper 53.3 (n = 260)
The share goes up a little among higher classes, but the differences are not statistically significant. Enjoying nature is common at all social levels.
While we're focusing on class, let's look at the belief among whites that the Bible is inerrant. In an earlier post, I looked at differences by education, but occupational prestige is a more direct measure of social class. I'm highly educated but far from upper class.
Percent who believe Bible is inerrant
Lower 37.8 (n = 1,345)
Working 34.0 (n = 1,725)
Middle 25.1 (n = 1,318)
Upper 17.9 (n = 751)
The lower and working classes are not significantly different, but all other comparisons are. The claim that Biblical fundamentalism is an middle- or upper-class movement is simply incorrect.
Wednesday, November 02, 2011
Ethnicity and camping
Half Sigma has observed that black folks don't enjoy nature. The General Social Survey asked Americans if they've gone camping in the past 12 months. Here are the percentages who answered yes by ethnic group:
Percent who camped in past year
Norwegian 66.7*
Dutch 52.9
Irish 52.4
Mexican 50.0
German 50.4
English/Welsh 46.7
Polish 46.2
Scottish 46.0
Italian 45.8
Russian 44.0
Jewish 40.6
Swedish 37.5
American Indian 13.3**
Blacks 10.7**
*significantly above average
**significantly below average
Blacks are at the bottom of the list. American Indians are next which is pretty ironic. Perhaps sleeping in a teepee isn't camping, it's home.
Half Sigma also claims that working-class whites love nature. I think he's right. (My blue-collar parents practically live in the wild.) We'll look at the data next.
How much evidence of racism?
Herman Cain was asked if racism is behind the story that he may have sexually harassed some employees. He answered yes. His next statement succintly summarized the grounds for the daily cries of racism we hear in contemporary America. When asked if he had any evidence to support his claim, he said no, none.
Monday, October 31, 2011
Ethnicity and nihilism
I calculated mean nihilism scores by ethnic group. (The question is about agreement that life serves no purpose, sample size = 3,051):
Mean nihilism score
Mexicans 1.93*
Filipino 1.80
Polish 1.78*
Puerto Rican 1.74
Czech 1.73
French Canadians 1.69
American Indian 1.68
Blacks 1.59
Swiss 1.58
Danish 1.57
Hungarian 1.55
Average 1.55
French 1.51
Italians 1.51
Asian Indian 1.50
Spanish 1.50
Germans 1.50
Chinese 1.50
Scottish 1.48
Jewish 1.48
Dutch 1.47
English/Welsh 1.47
Irish 1.48
Yugoslavs 1.40
Norwegian 1.40
Swedish 1.36**
Russian 1.35
Greek 1.33**
* significantly above average
** significantly below average
Data analyses on this blog have revealed again and again that Mexican Americans are in many ways a distinctive group. The gap between them and Greek Americans is large--three-quarters of a standard deviation. One reason why farm workers are nihilistic (as we saw in the previous post) is because they are disproportionately Mexican.
Sunday, October 30, 2011
Finding purpose
For those looking for direction in life, I think I've found a method. Ask yourself what you are willing to die for, and live for that. When I pose the question to myself, the answer that immediately comes to mind is my children.
Friday, October 28, 2011
Occupation and nihilism
General Social Survey (GSS) participants were asked if they agree that life serves no purpose. Answers range from strongly disagree (1) to strongly agree (5). I calculated the mean by occupation and list below the top and bottom five:
Nihilism--Top Five Means
Farm workers 2.20
Health aide 1.91
Construction laborers 1.89
Sewing machine operator 1.88
Farmers 1.86
Machine operator 1.86
Nihilism--Bottom Five Means
Sales supevisor 1.30
Other finanical officers 1.25
Financial managers 1.20
Managers 1.19
Real estates sales 1.17
The difference between farm workers and real estate sales is large--1.3 standard deviations. Evidently, a sense of meaningless is more of a problem for people with low status, repetitive occupations. Jobs with power and money are correlated with less nihilism. Perhaps powerlessness is a major source of thinking that life serves no purpose.
Wednesday, October 26, 2011
Social class and fundamentalism
A reader commented in the "Fundamentalists and delinquency" post that belief in the inerrancy of the Bible is an upper-class phenomenon.
GSS participants were asked: "Which of these statements comes closest to describing your feelings about the Bible? 1. The Bible is the actual word of God and is to be taken literally, word for word. 2. The Bible is the inspired word of God but not everything in it should be taken literally, word for word. 3. The Bible is an ancient book of fables, legends, history, and moral precepts recorded by men."
Here are mean levels of education by answer for whites (sample size = 19,324):
Word of God 12.01
Inspired word 13.71
Book of fables 14.33
Other 14.13
At the 95 percent confidence level, the Inspired Word group is significantly more educated than the Word of God group, and the Book of Fables group is more educated than both of them.
Saturday, October 22, 2011
Racial differences in child abuse deaths
BBC News is making a big deal about the high rate of child abuse deaths in America. Michael Petit, president of Every Child Matters, gives a long list of liberal explanations for the problem. For all his expertise, he somehow forgot to mention race. According to CDC data, the deaths of 0-4 years olds per 100,000 by race for the 1999-2007 period are as follows: Asians 1.6, non-Hispanic whites 2.5, Hispanics 3.2, American Indians 6.6, and blacks 8.3.
Petit, I'm sure, is privately aware of the racial differences, but he might not know about regional differences among non-Hispanic whites:
New England 1.3
Mid-Atlantic 1.7
Pacific 2.0
S. Atlantic 2.5
West North Central 2.6
East North Central 2.8
East South Central 3.0
Mountain 3.1
West South Central 3.1
Coastal whites are less violent.
Wednesday, October 19, 2011
Fundamentalists and delinquency

*significantly more than fundamentalists
White Add Health respondents (sample size = 3,489) were asked, "Do you agree or disagree that the sacred scriptures of your religion are the word of God and are completely without any mistakes?" The above table shows the percentages who have committed a specific crime at least once in the past 12 months. "Fund" is short for fundamentalist.
You can see a tendency of fundamentalist teenagers to be more law-abiding than youths who don't believe scripture is inerrant. Keep in mind that fundamentalists have the disadvantages of lower average IQs and socioeconomic status. They are not less violent, just less prone to commit property crime. Perhaps conservative religious people are the same as others on attitudes toward violence, but are more respectful of property.
Monday, October 17, 2011
Trends in Catholic religiosity

In his new book Suicide of a Superpower, Pat Buchanan claims that since Vatican II, American Catholics have gotten less religious and more culturally liberal. The graph (GSS data, sample size = 13,432) shows that he's right. Attending more than weekly (gray) or weekly (pink) is down. The following are up: 2-3 times a month (magenta), once a month (gold), once a year (green), and never (red).

This graph shows that Catholics are slightly more approving of abortion for any reason than they were in the 1970s.
Trends for Mexican Americans (data not shown) are more conservative. Attendance has basically held steady over the past four decades, and support for abortion on demand has actually dropped from 38 to 23 percent. My guess is that the constant infusion of new immigrants from Mexico keeps Catholic Mex-Ams religious and comparatively conservative on abortion.
Sunday, October 16, 2011
Thursday, October 13, 2011
I see that Warren Buffett paid $7 million last year in federal income taxes. He and I are two American citizens who have a duty to contribute to our country. I'm a middle-income college professor. The federal government paid me $2,000 last year (I paid in 2k and got a return of 4k). How am I getting screwed, exactly?
Trends in support for the death penalty

This graph from Gallup reveals a pragmatic streak among Americans on the issue of the death penalty. During periods of low or declining violence (the 30s, 40s, 50s and the past 15 years) more people get compassionate and idealistic. But Americans abandon their idealism when things get dangerous. The 1965-1995 crime wave was accompanied by growing support for executions. My own take is that this pragmatism is an American strength.
Tuesday, October 11, 2011
Mormons and delinquency

These numbers, based on Add Health data, show that Mormons tend to be less delinquent than teens with no religion. Most differences are not statistically significant because the sample includes only 79 Mormons.
Monday, October 10, 2011
Illegal immigration and military spending
According to the GSS (sample = 681), among those who consider immigration to be the single most important national issue, 42.4 percent feel that we don't spend enough on defense. Compare that to only 27.8 percent of all respondents. I suspect that people who are especially concerned about national security tend to be both hawkish and strongly against illegal immigration.
Sunday, October 09, 2011
Evangelicals and cheating
Are married born-agains less likely to cheat than others? Looking at GSS data (sample size = 6,423), the answer is no. Among whites, the percent unfaithful is 16.5 for evangelicals and 17.7 for everyone else. For blacks, it is 24.7 and 26.6 percent. The differences are not statistically significant. I checked to see if controlling for education would change the results. It doesn't.
Wednesday, October 05, 2011
Birth Order and the Big Five
A new study reports that there is no connection between birth order and Big 5 personality traits:
The hypotheses of Sulloway (1996) regarding birth order differences in five-factor model personality traits were tested in a sample of 231 college students with the NEO Five-Factor Inventory (NEO-FFI; Costa & McCrae, 1992). Data were collected from three sources (self, peer, and parent) to systematically evaluate previous observations that birth order differences are more commonly found when ratings are obtained from family members than from observers outside the family (Ernst & Angst, 1983). Using a between-family design, students were selected only from families with two or three full biological siblings and no half-siblings, step-siblings, or adopted siblings. Firstborn (n = 103) and laterborn (n = 128) students were compared using NEO-FFI ratings by the self, by a same-sex college peer, and by a biological parent. No birth order differences were found for any of the five NEO-FFI scores using any of the three rating sources. Effect sizes (Cohen’s d) were less than .20 for all comparisons.
Monday, October 03, 2011
Libertarianism and atheism
I looked at GSS data to see what percentage of right libertarians are atheists. There is no ideal way I know of to isolate this political group. The best I could do was to focus on people who think marijuana should be legalized who also say that they are conservative on a conservative/liberal continuum. Belief in God looks like this (sample size = 3,239):
Percent
Doesn't believe 3.0
No way to know 5.9
Some higher power 10.2
Believes sometimes 4.3
Believes but doubts 20.6
Knows God exists 56.1
And among conservatives who don't want pot legalized:
Doesn't believe 1.3
No way to know 2.2
Some higher power 4.8
Believes sometimes 2.9
Believes but doubts 13.2
Knows God exists 79.6
While a higher percent of libertarians have less confidence in God's existence, the vast majority are not atheists.
The risk of sexual assault
What percent of men are sexually assaulted? I looked at MIDUS Study data and found that 4.9 percent report at least one victimization. For women, the number is 22.2 percent.
How much of this happens to people who've spent time in jail? Sixteen percent of men who have been locked up have been sexually assualted. Only two percent of never-incarcerated have been victims. For women, 73 percent of women who have served time have been assaulted, compared to 12 percent of women who have never been in jail. Keep in mind that we don't know if assaults happened in jail or not.
The very high figure for criminal women suggests that female victims of male rape are not a random sample of women. Women who are raped are probably more likely to hang out with criminals and to put themselves into dangerous situations.
Wednesday, September 28, 2011
Most important predictor of reduced family size?
Which factor reduces family size the most? Below are the standardized OLS regression coefficients for a sample of whites ages 40-59:
Standardized OLS regression coefficients
Education -.23*
Income .10*
IQ .00
Church attendance .10*
Belief in God .06*
Political conservatism .06*
*p < .05, two-tail test
Education reduces fertility more than any factor. IQ has no net impact. Look at how income has a significant positive effect on family size. Not surprisingly, religiosity and conservatism are associated with more children.
Friday, September 23, 2011
Improving general intelligence with pharmacological intervention
From the journal Intelligence:
Cognitive enhancing substances such as amphetamine and modafinil have become popular in recent years to improve acute cognitive performance particularly in environments in which enhanced cognition or intelligence is required. Nutraceutical nootropics, which are natural substances that have the ability to bring about acute or chronic changes in cognition have also been gaining popularity in a range of settings and applications including the workplace, driving and in the amelioration of age related cognitive decline. Huperzine A, Vinpocetine, Acetyl-l-carnitine, Rhodiola Rosea and Alpha-lipoic Acid are popular nutritional supplements that have shown promising benefits in improving a range of biological (e.g., blood flow, anti-inflammatory, anti-oxidant, and direct neurotransmitter effects) and cognitive processes from in vitro, animal and human clinical research. We report here the first human randomized clinical trial for cognition in which we administer a combination of Huperzine A, Vinpocetine, Acetyl-l-carnitine, R. Rosea and Alpha-lipoic acid (called Ceretrophin) vs placebo. Sixty participants (40 females and 20 males, with a mean age of 45.4 years, SD = 12.6) completed either the odd or even items from the Raven Advanced Progressive Matrices (APM) at baseline and the opposite odd or even items at week 4 after consuming either the combination nootropic or placebo. A significant study visit (time) × treatment condition interaction was found: F (1, 57) = 7.279, p = 0.009, partial η2 = .113, with paired samples t-tests revealing a significant improvement in mean APM score from baseline to retest (week 4) (t(34) = − 4.045, p < .001) for the Ceretrophin™ group. Improvements in APM scores could be attributed to the active intervention over the placebo, indicating that the treatment improved general intelligence. Implications for improving our understanding of the biological basis of intelligence and pharmacologically improving human cognition are discussed.
Monday, September 19, 2011
Do really skinny women have fewer children?
Does extreme thinness cause a woman to be less fertile? I looked at women ages 40-59 who participated in the MIDUS Study. I limited the sample to people with at least a 4-year degree. Here are the mean number of children by body mass index (BMI) classification (sample size = 369):
Mean number of children
BMI under 20 1.45
20-29 2.10
30-39 2.08
A BMI under 20 is extreme in this sample: this group is only 3 percent of the total sample. And you can see that they have fewer kids.
Mean number of children
BMI under 20 1.45
20-29 2.10
30-39 2.08
A BMI under 20 is extreme in this sample: this group is only 3 percent of the total sample. And you can see that they have fewer kids.
Thursday, September 15, 2011
Lesbian cops?
There is a stereotype that female cops are lesbians. Is it true?
Using GSS data (sample size = 129) 15 percent of female law enforcement officers are homosexual or bisexual. According the the same survey, only 2.7 percent of all women are homosexual or bisexual.
How about gay cops? Do you remember the officer from the Village People? Out of 102 male officers, ZERO are homosexual or bisexual.
Wednesday, September 14, 2011
Conservative racism

These are results from a new Gallup poll. Explain to me how conservatives are such bigots when they like a black man more than eight out of nine white candidates (or potential candidates). And Cain isn't even white on the inside like Obama. He's a real black man.
Tuesday, September 13, 2011
Sex and bad vision
Looking at ADD Health data, I see that 36.9 percent of young males wear eyeglasses, contacts or both. The number for young females is 53.4 percent. The difference is statistically significant. The pattern is the same for all races. Since this is an adolescent/young adult sample, I assumed the sex difference is due to the earlier maturation of girls, but the gap is just as big for those in their mid-20s. How do we explain this? Male stubbornness? Male hunting/warfare?
Blacks and terrorism

According to this new Pew poll, native-born blacks Muslims are more likely to have favorable views of terrorists than other Muslims. Evidently, Islam attracts anti-American blacks and encourages their alienation. On the other hand, a low percentage of actual terrorists have been native-born blacks. This is consistent with the black tendency to talk more than act.
Monday, September 12, 2011
Hi Mom
I need to post something. You'd think I have a Jewish mother, or something. She worries about me all the time, but doesn't want to bother me calling too often, plus sometimes I'm hard to reach. So she checks my blog. If he's posting, she tells herself, at least I know he's not dead.
Wednesday, September 07, 2011
Blacks are more narcissistic
In a new study in the Journal of Research in Personality, it was found that, compared to whites, blacks have a higher average score on several measures of narcissism. Going from large differences to small ones, blacks are much more self-absorbed (d = .83); entitled (d = .61); they are more likely to be grandiose exhibitionists (d = .57); to see themselves as good leaders (d = .45); to feel superior (d = .37); to think they can fool most people (d = .29); and to try to avoid rejection at all costs (d = .24).
Having been given the title of Archetypical Victim, blacks are very prone to thinking of themselves as special. But with a high heritability of .64, narcissism might be a racial trait.
Having been given the title of Archetypical Victim, blacks are very prone to thinking of themselves as special. But with a high heritability of .64, narcissism might be a racial trait.
Monday, September 05, 2011
Religion and interest in a career in science
Does growing up in a religiously affiliated home discourage going into a scientific field?
Using GSS data, I divided respondents into natural scientists and everyone else. I then divided people into those who had a religion at age 16 versus those with no religion. To control for IQ, I limited the sample to people who scored between 7 and 10 out of 10 on a vocabulary test (sample size = 6,479). .6 percent of those from homes with no religion became scientists. By contrast, 1.4 percent of people from families with a religion grew up to become natural scientists.
The GSS offers no evidence that religion discourages an interest in a career in science.
Saturday, September 03, 2011
Skin color and educational level among blacks
ADD Health interviewers judged the skin color of respondents as black, dark brown, medium brown, light brown, or white. Limiting the sample to just African Americans, let's treat the measure as a rough indicator of the amount of European ancestry. Here is mean educational level by skin color (sample size = 1,211):
Mean educational level
Black 12.8
Dark brown 13.0
Medium brown 13.3*
Light brown 13.5*
White 12.8
*significantly higher than black category
Medium- and light-brown blacks are significantly more educated than black-skinned African Americans. White blacks--only 16 respondents--are the exception to the trend.
Thursday, September 01, 2011
Personality traits and obesity
New from the Journal of Personality and Social Psychology:
Personality traits contribute to health outcomes, in part through their association with major controllable risk factors, such as obesity. Body weight, in turn, reflects our behaviors and lifestyle and contributes to the way we perceive ourselves and others. In this study, the authors use data from a large (N = 1,988) longitudinal study that spanned more than 50 years to examine how personality traits are associated with multiple measures of adiposity and with fluctuations in body mass index (BMI). Using 14,531 anthropometric assessments, the authors modeled the trajectory of BMI across adulthood and tested whether personality predicted its rate of change. Measured concurrently, participants higher on Neuroticism or Extraversion or lower on Conscientiousness had higher BMI; these associations replicated across body fat, waist, and hip circumference. The strongest association was found for the impulsivity facet: Participants who scored in the top 10% of impulsivity weighed, on average, 11Kg more than those in the bottom 10%. Longitudinally, high Neuroticism and low Conscientiousness, and the facets of these traits related to difficulty with impulse control, were associated with weight fluctuations, measured as the variability in weight over time. Finally, low Agreeableness and impulsivity-related traits predicted a greater increase in BMI across the adult life span. BMI was mostly unrelated to change in personality traits. Personality traits are defined by cognitive, emotional, and behavioral patterns that likely contribute to unhealthy weight and difficulties with weight management. Such associations may elucidate the role of personality traits in disease progression and may help to design more effective interventions.
Monday, August 29, 2011
Liberals and family traditionalism
The verbal tricks of liberals show real audacity. You always hear how conservatives are divisive because we oppose things like abortion and gay marriage. Up until 40 years ago, practically everyone--even the irreligious--believed that traditional views of marriage and family were authoritative. Everyone took them for granted.
Then liberals came along, claimed that the institution was oppressive and antiquated, and they proceeded to tear it down. The truth is only obvious: THEY are the aggressors here. And when we start fighting back after getting smacked around, we're called divisive. Only verbal tricksters as deceptive as liberals could get away with walking up to you, punching you, and then crying about what a bully you are.
Then liberals came along, claimed that the institution was oppressive and antiquated, and they proceeded to tear it down. The truth is only obvious: THEY are the aggressors here. And when we start fighting back after getting smacked around, we're called divisive. Only verbal tricksters as deceptive as liberals could get away with walking up to you, punching you, and then crying about what a bully you are.
Gender and creativity
In a study of almost 1,000 Hong Kong children from the 5th through 7th grades, researchers found that while boys and girls had similar means on all ten sub-scales of creativity, the variation for boys was significantly higher for the overall score and for five out of ten sub-scale scores. Boys were particularly diverse on the boundary-breaking sub-scales.
These findings are similar to IQ research which shows higher variation among males. More of the dummies and the uncreative are found among boys, but so are geniuses and the highly creative. This lab research is consistent with history which is a tale of male accomplishment.
These findings are similar to IQ research which shows higher variation among males. More of the dummies and the uncreative are found among boys, but so are geniuses and the highly creative. This lab research is consistent with history which is a tale of male accomplishment.
Sunday, August 28, 2011
Born-again political clout
Ralph Reed makes the case that those who say that the powerful evangelical social conservative wing of the Republican Party is a thing of the past are flat wrong.
I did my own check. Of white GSS respondents polled in 2008 and 2010, 46.4% who describe themselves as slightly conservative, conservative, or extremely conservative also say they are born-again (sample size = 1,097). That sounds pretty powerful to me.
By the way, one-third of self-described moderates are born-again. This ain't no fringe group, and I see no signs that it is a passing fad.
Richard Lynn's second revised edition of Dysgenics
From a review in the journal Intelligence of Richard Lynn's second revised edition of Dysgenics:
The second edition contains two new chapters. The first of these documents the decline of the world's IQ arising from the high fertility of low IQ populations worldwide, compared with the low fertility in high IQ populations. Lynn calculates that the effect of this is that the world's genotypic IQ is deteriorating by 1.3 IQ points a generation. Thus, genetic deterioration of intelligence is taking place both within and across counties.
The second new chapter is concerned with the effects of immigration on the intelligence of the populations of the United States and Western Europe. Lynn argues that most of these immigrants have lower IQs than the host populations and, hence, that as their percentages in the host populations increase, the IQ of the populations will inevitably decline. For the United States he adopts the estimate of the Bureau of the Census that in the year 2050 non-Hispanic whites will be 45% of the population. He calculates that this will entail a decline of 4.4 IQ points of the American IQ over the fifty-year period from 2000 to 2050.
Lynn argues that immigration will also bring about a decline of intelligence throughout Western Europe during the course of the twenty-first century. For Britain, he adopts Coleman's (2010) estimate that the indigenous population will decline to 56% of the population by the year 2056, and the other 44% will consist of largely of South Asians and Africans from the Caribbean and sub-Saharan Africa. He calculates that this demographic change will entail a decline of 2.5 IQ points over the fifty-year period from 2006 to 2056. He calculates that similar declines will take place throughout continental Western Europe.
Looking further into the future, Lynn argues that the percentages of non-Europeans in the populations of the United States and Western Europe will inevitably continue to increase in the second half of the twenty-first century and beyond as a result of their continuing immigration and higher fertility. He argues that this will entail further declines in the IQs of the populations.
Some readers may be disappointed that Lynn does not spell out the geopolitical consequences of this, perhaps because he does not want to appear too controversial, but it must be questionable whether the world leadership of the United States and Western Europe in science, technology and economic development can be retained as the IQs of the populations fall and the populations come to resemble those of most of Latin America, in which European peoples are a minority.
Friday, August 26, 2011
More on Indians and environmentalism
As a follow-up to the last post, I wanted to see if contemporary American Indians (AIs) are more liberal on the environment than others. The GSS has asked respondents over the years if the federal government should spend more on protecting the environment. Sixty-one percent of AIs said we don't spend enough. Sounds like a lot? It's not: 62 percent of all Americans say we don't spend enough (N = 24,270).
Those numbers are based on data going all the way back to the 70s, however. If we limit it to just the past decade, 63 percent of both AIs and all Americans together feel we don't spend enough.
AIs are not currently liberal on the environment; they haven't been over the past 40 years; and I doubt they ever were. That crying Indian in the anti-littering commercial I saw as a kid is typical liberal anti-white propaganda. (Mexican Americans have a lot of AI ancestry and litter, on average, more than others.)
Wednesday, August 24, 2011
The myth of the Indian environmentalist
From pages 404-405 of A Patriot's History of the United States:
Even before the introduction of the horse, Indians had hunted bison, though not nearly as effectively. They tracked herds on foot, often setting fire to the grasslands in a massive box, surrounding a herd, except for a small opening through which the panicked animals ran--and were laughtered by the hundreds.
Frequently, though not universally, Indians destroyed entire herds, using fire or running them off cliffs. One Indian spiritual belief held that if a single animal escaped, it would warn all other animals in the region, and other Indian concepts of animals viewed the animal population as essentially infinite, supplied by the gods. Ecohistorians agree that although hunting by the Plains Indians alone did not threaten the bison with extinction, when combined with other natural factors, including fire and predators, Indian hunting may have put the buffalo on the road to extinction, regardless of the subsequent devastating impact of white hunters.
The fatal weakness of the Plains nomads regarding the buffalo was expressed by traveler John McDougall when he wrote of the Blackfeet in 1865, "Without the buffalo they would be helpless, and yet the whole nation did not own one." The crucial point is that the Indians did not herd and breed the very animal they depended on. No system of surplus accumulation existed. Since the entire source of wealth could rot and degrade, none could exist for long. Moreover, the nomadic life made it impossible to haul much baggage and therefore personal property could not be accumulated. This led fur trader Edwind Ding to conclude that this deficiency prevented Plains nomads from storing provisions and made them utterly dependent European trade goods.
A great ecomyth has appeared, however, about the Indians and their relationship with the buffalo, wherein Indians were portrayed as the first true ecologists and environmentalists. Nothing could be further from the truth. Traveler after traveler reported seeing rotting carcasses in the sun, often with only a hump or tongue gone. While the bison was, as Tom McHugh claimed, "a tribal department store" with horns used for arrows, intestines for containers, skins and hides for teepee coverings and shields, and msucle for ropes, it is misleading to suggest that Indians did not wantonly slaughter buffalo at times. Father Pierre De Smet observed that an Assinboin hunt in which two thousand to three thousand Indians surrounded an entire herd of six hundred bison and killed every one. Aside from their own deprivation--which they could only notice when it was too late to prevent--the Indians had no way of estimating or tracking the size and health of the herds, and even if they could, nomadic lifestyle "made it difficult to enforce mandates against waste."
Tuesday, August 23, 2011
Ron Paul could beat Obama?
According to an August 18th Gallup poll of registered voters, a head-to-head between Ron Paul and Obama gives Paul 45% and Obama 47%. (By the way, "don't knows" usually break for the challenger).
Wow.
Elites would never let Paul become President. If lack of financial support, media discrediting, or pinning a scandal on him failed to do the trick, somebody would put a bullet in his head.
Wow.
Elites would never let Paul become President. If lack of financial support, media discrediting, or pinning a scandal on him failed to do the trick, somebody would put a bullet in his head.
Monday, August 22, 2011
Quote of the week
"The war of the sexes is over, and we won. We won when women started doing pole dancing as exercise."
~Ryan Gosling's character in Crazy, Stupid Love
(Is it just me, or are we seeing Game being taught--like it is in the movie--more now in popular culture?)
~Ryan Gosling's character in Crazy, Stupid Love
(Is it just me, or are we seeing Game being taught--like it is in the movie--more now in popular culture?)
Saturday, August 20, 2011
Parasite load, race, and IQ
In this study of the 50 states, parasite prevalence (measured as the infectious disease rate) is strongly associated with lower mean IQ for all races combined (it explains almost half the variation in mean IQ). The authors interpret this to support the view that a distressed immune system during periods when the brain is developing results in a tradeoff that hurts IQ.
The problem is that, according to their data, the correlation between the infectious disease rate and percent black in a state is .90--the two measures are highly collinear. Childhood infectious disease rates are much higher among blacks, but in the U.S. the number of cases of cholera, measles, meningitis, pertussis, rubella, tetanus, or TB even among blacks is low. If parasite prevalence was a major cause of low IQ, the distribution should not be a bell-shaped curve but a small percentage of low-IQ individuals and a high percentage of people with normal IQs. Parasite prevalence could contribute something to low IQ, but I don't see how it could explain almost half of the U.S. variation in cognitive ability. The researchers should have examined race-specific data.
Parasite prevalence that the authors make such a big deal about looks to be simply a proxy for race.
Thursday, August 18, 2011
Blacks, dopamine, and IQ
In this new study in Intelligence, Add Health Study data is used to compare the average level of dopamine-related alleles among students of 36 different middle and high schools. This measure is strongly associated with lower mean IQs (Beta = -.47). The relationship is weakened substantially (to Beta = -.35) when the percent of the school that is black is added as a control in the OLS regression model.
What's the interpretation of this in plain English? It is this: Some schools have a higher percent of students with genes associated with a low IQ. These schools tend to have a low average IQ. So one important cause of low-IQ schools is having more kids with the bad genes. What the percent black predictor tells us is that: 1) schools with more blacks tend to have more students with the at-risk genes; 2) schools with a higher percent of blacks have lower intelligence levels; and 3) evidently an important reason why some schools are smarter than others is due to having fewer blacks--a group which has a higher prevalence of the bad genes.
This study contradicts the view that: 1) race is a social construction, and 2) the black-white gap in IQ has nothing to do with differences in genes.
Tuesday, August 16, 2011
Human ability, sex, and intelligence
An interesting article by Gil Greengross and Geoffrey Miller:
A good sense of humor is sexually attractive, perhaps because it reveals intelligence, creativity, and other ‘good genes’ or ‘good parent’ traits. If so, intelligence should predict humor production ability, which in turn should predict mating success. In this study, 400 university students (200 men and 200 women) completed measures of abstract reasoning (Raven's Advanced Progressive Matrices), verbal intelligence (the vocabulary subtest of the Multidimensional Aptitude Battery), humor production ability (rated funniness of captions written for three cartoons), and mating success (from the Sexual Behaviors and Beliefs Questionnaire). Structural equation models showed that general and verbal intelligence both predict humor production ability, which in turn predicts mating success, such as lifetime number of sexual partners. Also, males showed higher average humor production ability. These results suggest that the human sense of humor evolved at least partly through sexual selection as an intelligence-indicator.
Thursday, August 11, 2011
Gender differences in sexuality
According to this meta-analysis, gender differences in sexuality have shrunk over the past 20 years. Here are some of their results. A positive statistic indicates a male advantage:
Gender differences--Cohen's d
Heterosexual intercourse frequency .16
Number of sex partners .36
Age at first intercourse .20
Oral sex .06
Anal sex .09
Extramarital sex .33
Masturbation .53
Pornography use .63
Attitude toward premarital sex .17
Attitude toward extramarital sex .01
Attitude toward masturbation .02
Feelings of guilt -.19
Sexual satisfaction .17
Attitude toward homosexuality -.18
Same-sex sexuality -.05
Except for masturbation and pornography use, the differences now appear to be fairly small or even non-existent in some areas. Findings suggest that gender differences in sexuality can be shaped substantially by environmental factors. Women can be influenced to be more or less like men.
Predictors of cleanliness
I looked at the relationship between eleven predictors and the cleanliness of one's home as assessed by the GSS interviewer (sample size = 1,041):
OLS standardized regression coefficients
Age .15*
Male v female .02
Black v white -.12
Other v white .01
Size of city .00
South v North .00
Number of children -.04
Education .10*
IQ .08*
Church attendance .13*
Conservatism .06*
*statistically significant
The following predicts household cleanliness: being older, being more educated, higher intelligence, more frequent church attendance, and being more conservative poltically. The strongest significant predictor is age, while conservatism is the weakest.
You might see something different, but the image that emerges here is an establishment person--smart, educated, religious, conservative, and mature.
Wednesday, August 10, 2011
Religious affiliation and cleanliness
GSS interviewers rated the cleanliness of the homes of the people they surveyed. Cleanliness ranged from dirty (1) to very clean (5). Here are the means by religious affiliation (sample size = 1,893):
Mean cleanliness
Protestants 4.19*
Catholics 4.25*
Jews 4.37*
No religion 3.98
*significantly cleaner than those with no religion
People with a religion are cleaner than those without one. The means for Protestants and Catholics rise to 4.24 and 4.28 if I remove non-whites.
The correlation between church attendance and cleanliness is .15--a small but statistically significant relationship. And anti-religion people can't claim here that religious people are just lying about the behavior in question.
One more indicator that religious people tend to behave better than the irreligious.
Friday, August 05, 2011
Who visits mom?
I had a family studies professor who informed us students that Democrats are the people who care about others.
The GSS asked respondents how often they visit their mother (sample size = 355). I calculated the percent who visit at least monthly. The estimate is 72 percent for whites who voted for Bush in 2000. It is 63 percent for whites who voted for Gore or Nader. Among women, the respective figures are 74 and 62 percent.
The GSS asked respondents how often they visit their mother (sample size = 355). I calculated the percent who visit at least monthly. The estimate is 72 percent for whites who voted for Bush in 2000. It is 63 percent for whites who voted for Gore or Nader. Among women, the respective figures are 74 and 62 percent.
Wednesday, August 03, 2011
Religious affiliation and group identification

Pearson Correlations
U.S./ethnicity .45
U.S./religion .48
U.S./worldwide religion .66
ethnicity/religion .96
ethnicity/worldwide religion .88
religion/worldwide religion .92
First, there is an strong, general tendency to identify with multiple categories. (The average of the six correlations is .73 which is very high.) For example, Mormons have high levels of patriotism and ethnocentrism as well as religious identification. All groups tend to be patriotic, but comparatively speaking, the non-religious groups (atheists, agnostics, and those with no religion) are less patriotic, and they have low absolute levels of identifying with their ethnicity or any religious group. (You might respond that not identifying with a religion is obvious for an atheist or someone with no current religious affiliation, but John Derbyshire, for example, has expressed a fondness for the church of his youth. I have always identified with my childhood faith, both when I was a non-believer, and even now after switching denominations.)
You can also see that, among the groups, ethnic solidarity and religious identification really go hand-in-hand. The correlations are through the roof.
If you're looking for group lovers, search among Mormons, not atheists.
Another point--isn't it interesting that the most conservative groups are the most group-oriented but the least collectivist--in the political sense. Atheists and Jews are the most liberal, but are at the bottom on group-orientation. (This finding for Jews deserves its own post.) Mormons are the most conservative but identify with groups the most. Evidently, hunger for belonging is expressed by liberals in love of the State.
Measures of religiosity
I often use attendance at religious services as a measure of religious commitment (because it is usually the only question available) but there could be many reasons to go church: to please your parents, because you like some girl there, to find business opportunities, etc. How well does the measure actually tap sincere commitment?
Teenagers--individuals who are often forced to go to church--were asked in the Add Health Study: 1) frequency of church attendance, 2) frequency of prayer, and 3) importance of religion to self. I correlated the measures for 6,504 individuals:
Pearson Correlations
Church attendance-Importance .69
Church attendance-Prayer .66
Importance-Prayer .76
Getting correlations this high from survey data is rare (frankly, it feels good when it happens). Cronbach's alpha--a measure of how well the measures hang together--is .88 which indicates that the measures are tapping an underlying concept--religiosity.
The numbers are this high even though some of the teenage religious involvement is coerced. I conclude that any one of these questions is an adequate measure of religiosity.
Tuesday, August 02, 2011
Gender-atypical behaviors in kids and homosexuality
If a child shows gender-atypical behaviors, how well does that predict that he will develop a homosexual orientation?
According to a study by Sandberg et al., 23 percent of boys and 39 percent of girls act in at least 10 different ways that are categorized as gender-atypical. Since research puts gay men at about 3 percent of the population, and lesbians at about half that, most boys and girls who at times act like members of the opposite sex will not become homosexuals.
According to a study by Sandberg et al., 23 percent of boys and 39 percent of girls act in at least 10 different ways that are categorized as gender-atypical. Since research puts gay men at about 3 percent of the population, and lesbians at about half that, most boys and girls who at times act like members of the opposite sex will not become homosexuals.
Monday, August 01, 2011
White attitudes toward multiculturalism
In this new study in the Journal of Personality and Social Psychology, researchers report that whites implicitly associate multiculturalism with exclusion. They are less likely to see it as being something they are a part of. Whites with a high need to belong are less attracted to multicultural organizations. I interpret this to mean that socially independent whites are more enthusiastic about organizations that devalue their race. Overall, whites as a group do not buy the propaganda that multiculturalism is inclusive.
Sunday, July 31, 2011
Media-types are hacks
Journalists are a bunch of clueless sub-mentals. A constant refrain on MSNBC is that the American people are foursquare against not raising the debt limit. Clearly the opinions of typical Americans are shallow and poorly based, but according to a recent poll of a national probability sample of 904 people, 60 percent oppose raising the debt ceiling.
Don't rely on the media for facts. Do your own homework because these people are hacks.
Don't rely on the media for facts. Do your own homework because these people are hacks.
Friday, July 29, 2011
More on migraines
As a follow-up from my post on migraines, this is from Salon.com:
Interesting, but my favorite part is the male-to-female "transgendered" people. A guy's junk is removed, and he's pumped with hormones, but doctors refer to his status as a social construction--"gendered." Hilarious.
Why do migraines disproportionately afflict women?
Hormones, probably. About 18 percent of women suffer from migraines, compared with just 6 percent of men. Doctors have proposed several explanations for the disparity, including different levels of external stress and gender-related differences in the psychological response to pain. The best research, however, now suggests that sex hormones are to blame, and loads of circumstantial evidence support this theory. In women, the headaches typically begin after puberty and tend to decrease in both frequency and intensity after menopause. (Migraines are one of the few neurological disorders to subside with age.) They are also more common during menstruation and less common during pregnancy. Intriguingly, doctors treating male-to-female transgendered people have noticed that after their patients begin hormone therapy, they start to experience migraines with the same frequency as genetic females.
Although the research is still unsettled, there is growing scientific evidence that estrogen is the primary culprit. Migraines occur when inflammation around the brain triggers trigeminal nociceptors—cells responsible for pain sensations around the face—to transmit chemical signals. Nancy Berman and Kenneth McCarson, neurology researchers at the University of Kansas Medical Center, have shown that in mice these cells have estrogen receptors. Also, rats exposed to estrogen exhibit significantly worse migraine symptoms—except for nausea, since rats don't vomit—than their estrogen-starved counterparts at the same level of inflammation. At a biochemical level, they've documented changes indicating that pain signals are stronger when estrogen receptors are activated. Such evidence suggests the possibility that men might experience the inflammation associated with migraine just as often as women but their pain receptors have a less forceful response to it.
Interesting, but my favorite part is the male-to-female "transgendered" people. A guy's junk is removed, and he's pumped with hormones, but doctors refer to his status as a social construction--"gendered." Hilarious.
Adult religious affiliation among those with no religion as teenagers
Do children with no religion remain that way as adults, or do they eventually join up with some religion?
Out of those who had no religion at age 16, I calculated the percent who still had no religion in their 20s, 30s, 40s, etc. I also computed the percent who had switched to Protestantism--by far the most popular choice.
Percent of all those with no religion at 16
Ages 20-29
Stayed unaffiliated 67.6
Switched to Protestant 22.1
Ages 30-39
Stayed unaffiliated 54.4
Switched to Protestant 33.5
Ages 40-49
Stayed unaffiliated 48.4
Switched to Protestant 37.1
Ages 50-59
Stayed unaffiliated 37.8
Switched to Protestant 44.6
Ages 60-69
Stayed unaffiliated 36.7
Switched to Protestant 52.3
Ages 70-79
Stayed unaffiliated 30.9
Switched to Protestant 58.3
Ages 80-89
Stayed unaffiliated 26.2
Switched to Protestant 59.5
While two-thirds still had no affiliation in their 20s, by the end of their lives all but 26 percent had switched, and 60 percent of the total had joined some Protestant denomination.
(In order to maximize sample size, all survey years since 1973 were used, so age groups are from multiple cohorts.)
Monday, July 25, 2011
Liberal education predicts skepticism about the Bible, net of IQ
Half Sigma has done an interesting GSS analysis that shows that of the following three choices: 1) "the Bible is a book of fables, legends, history, and moral precepts recorded by men"; 2) "the Bible is the actual word of God and is to be taken literally"; or 3) "the Bible is the inspired word of God but not everything in it should be taken literally, word for word"-- a disproportionate percentage of high-IQ college graduates choose answer number 1. He concludes from the results that the Christian Right's view that liberal professors increase the skepticism of students is therefore false.
He would be correct if the Christian view were that a liberal education were the only cause of biblical skepticism. But I don't know of any Christian who claims this. A liberal education would be added to a list of other items like the influence of the wider culture--both elite and popular--and the dominance of the naturalistic worldview that non-mechanistic events are not possible. (Of course, a Christian would also include stubbornness/rebelliousness.)
Using the same GSS question, I created three dummy variables: 1) fables vs. literal word, 2) fables vs. inspired word, and 3) inspired word vs. literal word. The predictors are years of education and Wordsum--the proxy for IQ.
Logistic regression coefficients
Fables vs. literal word
Education .19*
IQ .23*
Fables vs. inspired word
Education .04*
IQ .05*
Inspired word vs. literal word
Education .16*
IQ .22*
In all three models, greater education predicts the more liberal position, net of the influence of IQ. The strength of the net influences of education and IQ are similar in each model. While the larger IQ coefficients makes it look like IQ is the more powerful predictor, the coefficients reflect the scale of the predictors, and education has twice as many categories as Wordsum. (The influence of education is actually probably a little stronger than IQ.)
Notice also how the coefficients in the fables/inspired word model are tiny: Smarter people and more educated people are only a little bit more likely to take the fable position. (In Half Sigma's table, very low-IQ people are more likely to think the Bible is a book of fables than average or above-average respondents. Based on his table, Half Sigma's conclusion really should be that the fable view is the view of geniuses and retards.)
The valid conclusion to draw from GSS data is that the Christian view is correct: liberal education (among other things) does increase skepticism.
Political orientation of young evangelicals remains stable

Some strategists argue that Republicans need to become more moderate since young people, even young evangelical conservatives, are more liberal than previous generations. The number of young people who voted for Obama is frequently hyped.
I generated the above graph which is of born-agains ages 18-29 (sample size = 4,446). The political orientation of this demographic has remained stable across four decades. As you move left to right, you can see small changes, but they are probably just noise.
Subscribe to:
Posts (Atom)
Are gun owners mentally ill?
Some anti-gun people think owning a gun is a sign of some kind of mental abnormality. According to General Social Survey data, gun owners ...

-
 In the comments in the last post , some readers contended that Jews are not ethnocentric. Using the same question I used in the comments se...
 -
Via a reader at iSteve, it looks like this might be the vocabulary test used by the General Social Survey. (Someone please tell me if I'...
-
I've been distributing a questionnaire to students which, among other things, asks them their religion. Quite a few have answered "...