Extraversion and lifetime sex partners: Here are the median lifetime sexual partners for different demographic groups ages 30-59 by level of extraversion:
Extraverts
White men 8.0
Black men 10.0
White women 4.0
Black women 3.0
Introverts
White men 5.0
Black men 10.0
White women 3.0
Black women 3.0
Extraversion is associated with more partners for both white men and women, but not for blacks. It seems odd that introverted black men have the same median partners as extraverted black men.
And you can see the typical gender disparity: men are probably exaggerating while women are under-reporting their sexual experience. (Prostitutes probably up the male numbers as well). The gender gap is larger for blacks.
Tuesday, September 29, 2009
Do the devout tend to be conservative in all religions? Using GSS data (N = 43,542), I calculated the association between frequency of attendance of religious services and level of political conservatism. The correlations are all positive for Abrahamic religions, but what about other religions? Look:

The relationship is negative, and the magnitude is noteworthy for all except Buddhism.

The relationship is negative, and the magnitude is noteworthy for all except Buddhism.
Monday, September 28, 2009
Extraversion and type of job: I put together a list of the mean introversion scores of people in various occupations. I included them if they were significantly higher than average ("introverts") and if they were significantly lower ("extraverts"). The sample size is 16,796 (GSS).
Introverts
Mail clerks, except postal service 16.3
Laundering and dry cleaning machine operators 16.0
Postal clerks, except mail carriers 15.9
Statistical clerks 15.7
Licensed practical nurses 15.7
Typists 15.6
Private household cleaners and servants 15.5
Farmers, except horticultural 15.4
Textile sewing machine operators 15.4
Farm workers 15.3
Maids and housemen 15.3
Librarians 15.3
Bus drivers 15.1
Hand packers and packagers 15.1
Laborers, except construction 15.1
Machine operators, n.s. 15.1
Cooks, except short order 14.9
Assemblers 14.9
Nursing aides, orderlies, and attendants 14.8
Bookkeeping, accounting, and auditing clerks 14.7
Janitors and cleaners 14.7
Registered nurses 14.5
Secretaries 14.3
Extraverts
Designer 13.2
Managers, properties and real estate 13.1
Real estate sales occupations 13.1
Painters, sculptors, craft-artists, and artist printmakers 13.0
Sales occupations, other business services 12.9
Advertising and related sales occupations 12.5
Actors and directors 12.4
Airplane pilots and navigators 12.1
Architects 11.8
Athletes 11.7
Securities and financial services sales occupations 11.4
I don't see any big surprises. Introverts tend to have clerical or low-skill jobs, while extraverts have jobs requiring people skills (sales), leadership skills (managers), or creativity (designers, artists, actors).
Growing introversion: Here are America's mean introversion scores over four decades:
Mean introversion score
Seventies 13.8
Eighties 14.0
Nineties 14.1
This decade 14.2*
* p < .05, two-tail test, compared with the seventies
The country has gradually gotten a bit more introverted. This might be due to increasing numbers of Asians and Hispanics. (Immigrants in general tend to be more introverted).
Sunday, September 27, 2009
English Americans are most introverted, Jewish Americans are least: Here are mean introversion scores for various white American groups:
Mean introversion score (N = more than 20,000)
English/Welsh 14.2
Dutch 14.2
Swiss 14.2
Scottish 14.0
All ethnicities 14.0*
Irish 13.9*
Hungarian 13.9
Portuguese 13.9
Spain 13.9*
German 13.8*
Danish 13.7*
Rumanian 13.7
Polish 13.6*
Swedish 13.6*
Belgian 13.6
Italian 13.5*
Czech 13.5*
Russian 13.4*
Norwegian 13.4*
French 13.4*
Yugoslavian 13.4
Finnish 13.3*
Lithuanian 13.3*
Jewish 13.3*
* p < .05, two-tail test, compared with English/Welsh
The groups with asterisks are significantly more extraverted than Americans of English or Welsh descent. Here are the effect sizes for those who differ significantly:
Effect size
Irish .09
Spain .09
German .11
Danish .14
Polish .17
Swedish .17
Italian .20
Czech .20
Russian .23
Norwegian .23
French .23
Finnish .26
Lithuanian .26
Jewish .26
The differences among whites groups, even at the extremes, are small.
I checked to see if the observed pattern was influenced by immigration. I suspected that immigrants are more introverted than natives, and I was right. If we compare Jews and those of English descent born in America, the effect size increases to .37--a moderate difference.
Extraversion and number of offspring: As a follow-up to the last post, I looked to see if introverted people have more children (GSS data, N = 10,153). For people ages 40-59, the correlation between introversion score and number of offspring for each of the past four decades has hovered around .10. A trivial positive association.
Extraversion and marital status: Here are the mean introversion scores for each marital status for Americans ages 30-49 (GSS data):
Mean introversion scores (N = 2,870)
Married 14.6
Widowed 14.3
Divorced 13.5*
Separated 13.7*
Never married 13.0*
* p < .05, two-tail test, compared with married people
All groups except for widowed are significantly more extraverted than married people. Makes sense. Marriage is for homebodies. Introversion might help explain the lower divorce rate of Asians. Here are effect sizes:
Effect size
Divorced .32
Separated .25
Never married .46
The differences between married/widowed people and the other categories are small to moderate.
Saturday, September 26, 2009


Friday, September 25, 2009
Race, extraversion, and crime: Using last post's measure of extraversion, I wonder if it could help explain racial differences in crime. Ever getting arrested is the dependent variable. Here are the logistic regression coefficients, and I'm comparing two groups at a time:
Logistic regression coefficients
Whites and Asians (N = 3,087)
White 0.64
Extraversion 0.14*
Blacks and Asians (N = 468)
Black 1.46
Extraversion 0.12*
* p < .01, two-tail test
Compared to Asians, whites are more likely to get arrested, but the difference becomes non-significant when extraversion is entered into the equation. The exact same thing happens when we compare blacks and Asians. So the evidence here suggests that extraversion helps explain the racial gap in criminality.
But why, you ask, would extraversion raise the risk of breaking the law? Compared to, say, the guy who likes to spend his time blogging alone, people who love to be out doing things with other people are more likely to find themselves in situations conducive to crime. And they would be less likely to back away from criminal opportunities.
Thursday, September 24, 2009
Another look at extraversion: I took another approach to measuring racial and ethnic differences in extraversion by looking for GSS behavioral questions. Respondents were asked how often they: 1) visit neighbors, 2) visit friends outside of the neighborhood, and 3) go to a bar. Answers varied from "almost every night" (1) to "never" (7).
These items were all positively correlated with each other, but Cronbach's alpha is only .45. I summed them together to create an introversion score and limited the analysis to those ages 30-49 out of concern that the groups might have different average ages and that going out, especially to bars, is influenced by age. Fortunately, the sample size is large (N = 9,528).
Introversion score
White 13.80
Black 13.91
Mexican 14.84*
Chinese 14.79*
Filipino 14.57
American Indian 15.04*
*p < .05, two-tail test, compared with whites.
Consistent with the earlier analysis, blacks and white do not differ, but Mexican Americans are significantly more introverted. The large sample size allowed me to look at other minority groups, and you can see that Chinese Americans and American Indians are less outgoing. The difference between whites and Filipinos fell just short of statistical significance. I went ahead and calculated the effect sizes too:
Effect size
Mexican .30
Chinese .29
Filipino .22
American Indian .36
These numbers indicate small to moderate ethnic/racial differences. Keep in mind that broad heritability for extraversion is around 0.5.
A significant number of the angry people on the Left are criminals: President Carter informs us that right-wingers who are angry at Obama are overwhelmingly racist. How does he know this? Because they're mad, and Obama's black. Two plus two equals four, right dummies? Just like a year ago when all the right-wingers were ringing talk radio's phones off the hook with angry calls concerning plans for bailout. All that rage was proof positive that conservatives hate white people. Bush is white, isn't he?
I'll believe Carter's "overwhelmingly" claim when he brings me a carefully conducted study where, say, 80% of right-wingers report hating black people.
Oh, but I just happened to have data showing that a sizeable share of left-wingers are criminals. According to the General Social Survey, 29.8% of very liberal guys ages 18-59 say they have been arrested before. Therefore, it is illegitimate to oppose Republican policies because that's what gangsters do.
When I follow the example of liberals and smear the other side, at least I bring some evidence.
Tuesday, September 22, 2009
Inductivist hits a thousand: This blog has now reached the milestone of one thousand posts. Of those, perhaps 700 or so have been data analyses, and my plan is to continue to anger the folks at the National Opinion Research Center (GSS people) by answering all the wrong questions with their data.
But let's mark the occasion with something amusing that just happened to me. After finishing his test, a black student came up to me a laid his exam on top of the stack and then proceded to ask me a long list of questions about the online course he was also taking from me. I turned away from him to pull up his information on the computer, but after a second turned my head back and he was leaning over the top of his exam and had his arms around the stack to hide the fact that he was trying to write on his exam. I told him to stay away from the test; you can't touch it after you've turned it in. He denied touching anything, but it was obvious to me that he had quickly looked at the answers on the first page of the test beneath his before placing his on top, then he had started to ask me questions about the other course so I would turn my back, so he could change his answers. He wasn't even listening to what I saying about his online course.
After he left, I looked at his test and saw that four true-false questions had been changed on the first page and thought, "The bastard has got me because I didn't actually see him change his answers, and he, of course, would claim he changed them before turning in the exam." Then I looked closer and laughed because all four answers were now wrong! He had gone to all this trouble to cheat right under my nose, and his original answers were correct! It's like I always tell my students: Don't cheat off your neighbor because chances are, he's dumber than you are.
Sunday, September 20, 2009
Race and the Big Five

* p < .05, two-tail test, comparison with white counterpart.
The General Social Survey asked ten questions in 2006 about personality traits--two questions for each of the Big 5. Two questions per trait is not nearly enough (typical performance by sociologists) but we'll use what we've got.
For extraversion, the questions asked about outgoingness, and for agreeableness, people were asked if they agreed that they didn't find fault in others and trusted them. On conscientiouesness, people were asked if they agreed that they were hardworking and thorough. Questions for emotional stability asked about agreeing that you are relaxed or prone to nervousness.
Respondents were asked if they are imaginative and artistic, so I called this measure "creativity." Answers to these pairs of questions were summed. You see the means in the table.
Whites are significantly more extraverted than Mex-Ams, but do not differ from blacks. Blacks are more agreeable than whites, but Mex-Ams are less so. The group do not differ on conscientiousness.
Blacks are more emotionally stable than whites. This contradicts findings from my last post, but keep in mind that the measure I used before tapped depression more than anything else, while this one focused on how relaxed someone is.
Finally, the groups do not differ on creativity.
One comment about the data: it's clear that respondents lack some objectivity because a disproportionate number of people describe themselves as having what I'm sure people see as the positive quality. Few people admitted that they are lazy and fail to do a thorough job. Conscientiousness was more skewed than any other measure, but the others were skewed as well. There is a tendency to think you're outgoing, agreeable, conscientious, relaxed, and creative, regardless of the facts. I don't know if groups differ in these biases, but there is an overall bias, no doubt.
Saturday, September 19, 2009
Race and negative emotionality--again: In the last post, data on college students revealed no significant difference between blacks and whites on the trait negative emotionality.
In some ways, the National Longitudinal Study of Adolescent Health (Add Health) is a better source of data because: 1) it's a sample of high school students, so it has much less of a range of restriction problem; 2) it includes several racial/ethnic groups; and 3) the sample size is much larger.
I summed answers from five questions about the respondents level of sadness, the blues, depression, fearfulness, and being bothered by things. Three of the questions deal with depression, so this characteristic is weighed heavily. Cronbach's alpha is .79 which indicates that we're measuring a single, underlying trait. Here are the mean scores:

N is 6,476, but of course it gets much smaller for individual groups. To maximize sample size, I first compared groups with males and females lumped together. All minority groups have significantly higher negative emotion scores than whites, but as the effect sizes indicates, differences are not large.
When we turn to gender-specific comparisons, minority groups sometimes differ from whites, but not always. Mexican American and Amerindian males are not higher in negative emotionality than white males, but black and Asian guys are. The black-white difference for females falls just short of statistical significance, but all other minority women have higher scores.
How do we make sense of these patterns? Most of the researchers I know would announce imperiously that this is proof of pervasive white racism. Minorities of all colors experience more negative emotions because they have to deal with us traumatizing white people all the time.
Following the example of my august colleagues, I will declare imperiously that white folks are genetically the most even-keeled of all races.
(By the way, I'm sure you noticed that women score higher on this trait. The effect size for whites is .35--I'd call that a moderate difference).
Friday, September 18, 2009
Narcissism, negative emotionality, and race: In an earlier post, I showed how homosexual men, as a group, are more narcissistic than straight men. Using the same survey, I used answers from 11 questions to develop a scale of negative emotionality (anxiety, moodiness, depression, emotional instability, etc.). Cronbach's alpha was .91.
I compared white and black men and found no statistically significant difference on the trait or on the narcissism measure (N = 814). Studies show that heritability for negative emotionality is .4 to .5, and it's as high as .6 for narcissism. The data here suggest that, even with moderate heritabilities, trait frequencies will not necessarily differ between racial groups.
I assumed the lack of race research on the Big Five was due to fear, but perhaps some of it is due to lack of difference. Anyone know of documented differences? I've guessed at some things, but haven't run across research (Lynn's work on psychopathy is an exception).
All this reveals one of the perversions of this era of racial hysteria (Jimmy Carter being the best recent example). IQ research has documented a huge racial gap, but since everyone is too afraid to research personality differences, it leads one to assume based on IQ research that blacks and whites are probably very different (and possibly genetically different) in many ways. Give us the damn research so we know the truth and don't have to guess!
Thursday, September 17, 2009
Suckiologists III: A genetic twin study on impulsivity (and other traits) by Eaves, Martin, and Eysenck was published in 1977 which showed very small shared environmental effects. Loehlin et al. (1987) reported zero shared environmental influence for impulsivity in a study of adoptees. A Swedish study (1988) found that the correlation for identical twins raised together was almost the same as that for identical twins raised in separate families indicating no effect of shared environment.
These methodologically powerful studies persuaded sociologists in the early 90's to drop their interest in the role of parenting in causing impulsivity.
Oh I'm sorry, in 1990, sociology started for the first time in forty years to focus on disciplinary styles. Sociologist Travis Hirschi and his colleague Michael Gottfredson published a book called A General Theory of Crime. In it the authors claimed that all crime is caused by a failure to punish children when they behave badly. Permissive parents raise kids who never learn to check their impulses and end up as career criminals. The theory is so powerful, the authors said, it even explains white-collar and organized crime.
Then, in 1998, the world of social science was rocked with Judith Rich Harris' The Nurture Assumption. She echoed these earlier studies--and many, many others--that pointed away from parental influence, and she suggested that peer influence was important instead. Sociological criminology naturally followed suit by turning its attention to peer influence.
Oh, I'm sorry, what actually happened is that Hirschi and Gottfredson's "self-control" theory went red hot and quickly became a leading criminological theory. Peer influence was so 80's. So now scads of studies are coming out showing a correlation between erratic parenting, impulsivity, and crime. Do they investigate the possibility that the correlation is due to genes? (I mean, broad heritability is .4 or.5, after all.) Of course not, only racist Neanderthals do that (when they're not opposing Obama).
Sociologists are classic examples of academic SWPL-hood. Their discipline is driven by fads. People jump at a new idea, get tired of it, and then jump to the next thing. Data has little to do with it. What a friggin' joke.
Wednesday, September 16, 2009
Mean offspring for smart and dumb Cads

In the table, I present the mean number of children for white men ages 30-59 who have had at least 20 sex partners. I divided them into those with IQs under 100 and those above.
The terms "Alpha" and "Beta" give the former too much credit, so I'm going to use "Cads" and "Dads" instead. We saw in an earlier post that, while Dads have more kids, the gap is narrowing. The table shows that dumb Cads are contributing more kids to the current generation than their more intelligent counterpart.
The number for the dummies may be rising a bit, while falling for the smarter group, but the changes are too small to make anything of them. One factor that complicates the analysis is that small sample sizes forced me to include a wide range of ages, so the extensive overlap across decades hides trends.
A request: Folks in the Steveosphere are frequently called bad names: haters, bigots, racists, fascists, Nazis, etc., etc. Well, in my opinion, a person should have some say about his put-downs. Go ahead and insult us, but please refrain from any slur not found in the following list:
Jap Lover
Beijing Butt Buddy
Yapping Fool with Yellow Fever
Seoul Sweetheart
East Injun Lover
Singapore Whore
Peking Paramour
Tokyo Truelove
Thank you for your cooperation.
Jap Lover
Beijing Butt Buddy
Yapping Fool with Yellow Fever
Seoul Sweetheart
East Injun Lover
Singapore Whore
Peking Paramour
Tokyo Truelove
Thank you for your cooperation.
Sunday, September 13, 2009
Homosexuality and narcissism
College males were asked the following questions while participating in the Longitudinal Study of Violence Against Women:
1. "I feel that 'I'm the greatest' and better than other people."
2. "I brag a lot about myself and what I do."
3. "I am a self-centered person. I want things to go my way."
4. "I remind myself that I'm "number one" and have to look out for myself first."
5. "I am better at doing most things than other people."
Answers ranged from "not at all like me" to "very much like me." I correlated the answers, and Cronbach's alpha was .76. Cronbach's indicates how well a set of items measures a single, underlying construct, and .76 is pretty good. So I summed the items and called it a narcissism scale. Next, I lumped gay and bisexual men together to increase N, and calculated means. For the gay group it is 12.00 (n = 39), and for straights it's 10.42 (n = 708). The differences are statistically significant (p < .05, two-tail).
German Jews less liberal? American Jews of Polish and Russian background have a reputation of being more liberal than German Jews. Is it true today?
I calculated "conservatism" means for the groups from GSS data. When asked about political views, respondents were offered a seven-point scale ranging from "extremely liberal" (1) to "extremely conservative" (7).
Mean conservatism score
German Jews 3.38 (n = 55)
Russian Jews 3.48 (n = 275)
Polish Jews 3.48 (n = 98)
No evidence here that German Jews are less liberal.
Occupation and lifetime sex partners

Here'a a table of the median lifetime sex partners for the occupations with at least 100 GSS sampled white men. I use median since the mean is completely thrown off by the small number of men with dozens and dozens of partners. Keep in mind that the overall mean for white men is about 6.
Managers, salesmen, and those with muscular jobs are toward the top (although supervisors and proprietors, sales occupations is an anomaly) and computer geeks, low status janitors, and farmers are at the bottom. I suspect farmers are more traditional and marry early.
Saturday, September 12, 2009
Mean number of offspring for Alphas and Betas

Following Thursday's suggestion, I calculated mean number of children for Alphas and Betas at different IQ intervals. The sample includes white men ages 30-59 from the 1990s and this decade (in order to maximize N). Betas of various intelligence levels are fairly similar in their family size. Mean number of offspring, however, drops more steeply among Alphas as IQ rises. Evidently, the dumb guys and their partners have sex more recklessly.
Wednesday, September 09, 2009
Alpha and Beta IQs

Here are the IQ percent distributions for Alphas and Betas. I widened the age range to 25-59 and the period to the 1990s and this decade to maximize N since I couldn't detect differences with a smaller sample. It still seems the two groups don't really differ in terms of intelligence. (It looks like there might be a few more retarded and really dumb as opposed to just plain dumb Betas).
Sunday, September 06, 2009
Alphas, Betas, and Marital Status

The table lists the percent distribution for Alphas (20-700 lifetime sex partners) and Betas (1-2 partners) based on GSS data. I'm using the same age, race, and period: whites in this decade ages 30-39. You can see that Betas are much more likely to be married, while Alphas are more likely to have never married. No surprise there.
But look at the divorced and separated statistics. I thought that any woman who could catch a Real Man would never let him go, no matter what, while married women with squishy Betas would throw them over for even a smile from Mr. Testosterone. The percent of divorced Alphas is eight times that of Betas.
These facts are consistent with my view that while some women like the idea of a roll in the hay with Studly, on a day-to-day basis they want a man who treats them well. Women like attention, consideration, thoughtfulness, responsibility, and generosity. If she gets treated like dirt, she's eventually going to move on, no matter how sexy the guy is.
Saturday, September 05, 2009
More on Alphas and Betas: Let's compare these two groups. Keep in mind that I'm defining them as guys with twenty or more lifetime sex partners and those with one or two, and I'm focusing on white thirty-somethings from this decade:
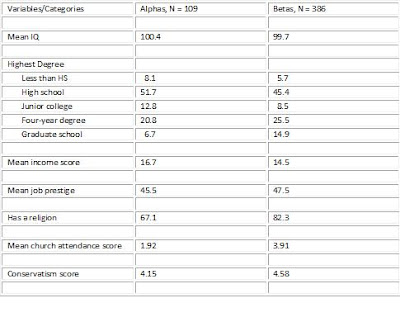
Alphas are a bit smarter, but are less educated. They earn substantially more, but have less prestigious jobs. They are less likely have a religion, they attend services much less often, and they are less politically conservative.

Alphas are a bit smarter, but are less educated. They earn substantially more, but have less prestigious jobs. They are less likely have a religion, they attend services much less often, and they are less politically conservative.
Friday, September 04, 2009
Median number of sexual partners: Feminist X makes a good point that we shouldn't assume that a given number of sexual partners now and in the past measures the same trait. The same guy who had two partners in the past might have 20 partners now.
My earlier analysis only covers the past three decades, so I think the period is short enough to assume that we're measuring the same thing in each of the three decades (80s, 90s, 00s). But it's always better to check.
The mean number of sex partners for white men ages 30 to 39 looks like it hasn't changed much since 1980, but the mean is a poor statistic to use because it is very sensitive to the handful of guys with many, many partners. The median is much better: it was seven partners in the 80s and 90s, and it's six in this decade. Cultural conditions don't seem to have changed much.
Thursday, September 03, 2009
Alphas and Betas

Alphas, N =360

Betas, N = 384
These graphs show the trends in number of offspring over the past three decades for white men ages 30-39 having a lifetime total of 20-700 sexual partners (Alphas) and those with only one or two (Betas). There are only about 30 cases for each group in the 1980s, so we should pay more attention to the last two decades. First, it's clear that Alphas were more likely to be childless prior to this decade, but the gap has almost disappeared. Now, Alphas are more likely than Betas to have one kid but less likely to have two. Twenty-percent of both groups have three or more.
If we look at means instead, we get:
Mean number of children
Alphas
1980s 1.11
1990s 1.03
This decade 1.23
Betas
1980s 1.64
1990s 1.66
This decade 1.44
The story is similar here. Betas average more kids, but the gap is narrowing. Standard deviations (not shown) are increasing for both groups too, indicating greater variation in this decade.
So the two groups are converging: more Betas are now childless, while Alphas are reproducing at greater numbers. It looks like fewer Betas are able to find a partner now, and perhaps women are becoming more willing to have an Alpha's baby. Single motherhood is becoming more common and acceptable for whites, so women might be more willing to risk having a baby with an unreliable man.
Predictions are a very dicey business, and Alphas are still less prolific, but if current trends continue, Alphas could surpass Betas in the baby race.
Tuesday, September 01, 2009
Sexual behavior and number of kids
From Half Sigma:
Good stuff, but it looks like the data don't really support the idea that, compared to, say, 50 years ago, promiscuous men are producing more babies, while more monogamous men are failing to reproduce. Audacious has shown that men with only one lifetime sexual partner have the largest families. This is true for all races, and the correlation across categories is strong (.57).
How many female sexual partners you've had since 18 was asked on the General Social Survey twelve different years from 1989 to 2008. Men of all ages were asked the question, so a skeptic like Whiskey might argue that the sample is loaded with old men whose prime reproductive years were during an earlier era where sexuality operated differently. So let's look at men ages 30 to 39 from this decade. (We need to choose men who are old enough to have demonstrated their sexual pattern). I focus on white men since the black sample size is insufficient.

The pattern is the same as that observed by Audacious: the group with the most kids are men who've only had one sex partner since age 18. And these men were in their teens in the 80s and in their twenties during the 1990s, so they do not come from an era where out-of-wedlock births were uncommon.
Next, we'll look at trends to get a sense of the future.
What Roissy calls “beta behavior” evolved because it’s the most successful reproductive strategy in a civilized society. When pre-marital and extra-marital sex was very strongly discouraged by society, being able to talk a girl into bed didn’t mean spreading your genes as much as it meant being forced to marry her at the end of a shotgun (or crossbow or sword or whatever weapon was used back then), or even worse, killed by her angry relatives, put in jail for the crime of adultery, etc.
Modern society is now reverting to a more primitive form, and the beta behavior bred into humanity over many thousands of years will much more quickly be bred out.
Good stuff, but it looks like the data don't really support the idea that, compared to, say, 50 years ago, promiscuous men are producing more babies, while more monogamous men are failing to reproduce. Audacious has shown that men with only one lifetime sexual partner have the largest families. This is true for all races, and the correlation across categories is strong (.57).
How many female sexual partners you've had since 18 was asked on the General Social Survey twelve different years from 1989 to 2008. Men of all ages were asked the question, so a skeptic like Whiskey might argue that the sample is loaded with old men whose prime reproductive years were during an earlier era where sexuality operated differently. So let's look at men ages 30 to 39 from this decade. (We need to choose men who are old enough to have demonstrated their sexual pattern). I focus on white men since the black sample size is insufficient.

The pattern is the same as that observed by Audacious: the group with the most kids are men who've only had one sex partner since age 18. And these men were in their teens in the 80s and in their twenties during the 1990s, so they do not come from an era where out-of-wedlock births were uncommon.
Next, we'll look at trends to get a sense of the future.
Genes without Darwin

As a follow-up to the last post, I wanted to add that conservatives can draw on biological research without emphasizing evolution (Reader David expresses a similar idea). The point is that there is genetic diversity--whatever its source. It explains what nurturism cannot, and it's not going anywhere fast.
The graph shows two things: 1) a sizeable minority of Americans--I included all races--think that genes play a major role in determining personality; and 2) Republicans are a bit more open to the idea than Democrats. As the science continues to come out, conservatives would do well to sing the results from the rooftops. Leave Darwin out of it.
UPDATE: David Hume looks at belief in genes by demographic groups here.
Darwin, God, and politics: I see that the HBD-ers and social conservatives are currently duking it out. Since I consider myself to be both, I suppose I should punch myself in the face.
It seems to me that what is essential for a viable political movement is that it tells a persuasive, coherent story to a large segment of the population. I say coherent, but I didn't say something that was so internally tight, it must have been developed by Aristotle. Conservatism, I don't think, has ever claimed such internal consistency. It's more like a stance.
We can't all be Burkes. Someone needs to do the market research: I volunteer. This time around, let's look at the two Men who people seem to be siding with: God or Darwin. A movement needs to either: 1) favor a thing; 2) oppose it; or 3) shut up about it. The data indicate that in America, on the question of Darwin and God, it's probably best to shut up about both of them, but if we need someone to rally around, just make sure he's not Nietzsche.
In 2000, 1,023 Americans (GSS) were asked: 1) their confidence in the existence of God; and 2) how true is the statement that humans evolved from animals. Here are the top ten most common combinations of answers:
Percent of all respondents
1. Knows God exists--Evolution definitely not true 33.0
2. Knows God exists--Evolution probably true 14.7
3. Knows God exists--Evolution probably not true 11.5
4. Believes but doubts--Evolution probably true 7.7
5. Knows God exists--Evolution definitely true 5.8
6. Believes but doubts--Evolution probably not true 4.1
7. Some higher power--Evolution probably true 3.7
8. Believes but doubts--Evolution definitely true 2.9
9. Some higher power--Evolution definitely true 2.5
10. No way to know--Evolution definitely true 2.0
10. Doesn't believe in God--Evolution definitely true 2.0
Any American who likes to push atheism or likes to criticize believers must enjoy having no political voice whatsoever.
People are divided, on the other hand, when it comes to evolution. It's not popular with most people--my students think the whole thing stinks, as much as I push it--and it's especially unpopular among folks on the Right. On the other hand, it's intellectually satisfying to smart people.
So what's the solution? It looks to me like the only realistic way to go is for conservative elites to inform their worldview by sneaking peaks at HBD stuff when no one is looking, but they will have to fashion their ideas in a way that appeals to the common man. Does that sound like lying? Of course it does because that's what politics is, or haven't you noticed?
Subscribe to:
Posts (Atom)
Are gun owners mentally ill?
Some anti-gun people think owning a gun is a sign of some kind of mental abnormality. According to General Social Survey data, gun owners ...

-
 In the comments in the last post , some readers contended that Jews are not ethnocentric. Using the same question I used in the comments se...
 -
Via a reader at iSteve, it looks like this might be the vocabulary test used by the General Social Survey. (Someone please tell me if I'...
-
I've been distributing a questionnaire to students which, among other things, asks them their religion. Quite a few have answered "...