Progs love to tout what lovers of humankind they are. The General Social Survey asked people if they sometimes try to get even rather than forgive and forget. 20.8% of conservatives answered true, but liberals are 1.7 times more likely to seek revenge (34.5%).
Friday, March 03, 2023
Tuesday, December 27, 2022
Did Ireland used to be dumb? A look at eminent scientists
Some researchers have claimed that the average IQ of the Irish used to be really low by West European standards but has recently caught up, and this shows that IQ can be raised by improving social conditions.
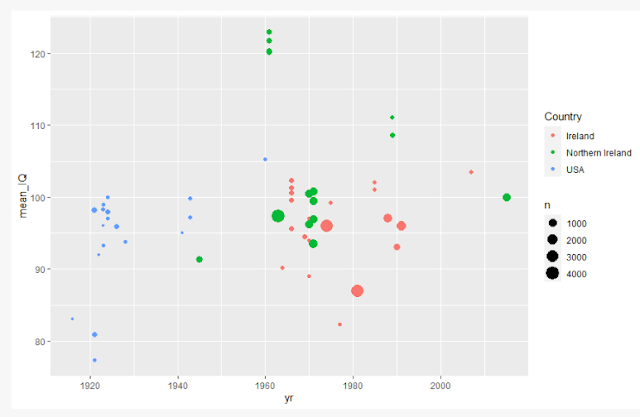
Russell Warne recently conducted an analysis of 55 samples of 29k Irish examinees, the IQ data collected in various years from 1916 to 2015. The mean was found to be 98.0. As you see in his graph below, there was at most a slight increase in mean IQ over this period. This pattern contradicts the optimistic nurturist view.
A reality-check approach might offer a nice complement to the IQ data. If mean Irish IQ were, say, 85 a century ago, we should not expect Ireland to have produced many eminent scientists.
I will rely on the inventories of significant scientists, mathematicians, and technologists listed in Charles Murray's Human Accomplishment. I will use Scotland, Denmark, Norway, and Finland as comparisons. They are NW European countries with population sizes roughly similar to that of Ireland, and as far as I know, no one has claimed that those countries used to be low-IQ.
You can see from the lists below that Scotland smokes the other countries with 57 significant figures. Pound for pound, Scotland is an impressive country. Denmark is a distant second with 14 eminent men, but Ireland is a close third with 13 significant figures. Norway has 8, and poor Finland only has one. Impressive country but not for its past scientists.
So Ireland falls to the middle of the pack. No reason here to think that the Irish used to be dumb but have only recently improved their intelligence level.
Scotland -- 57 Significant Figures
Astronomy
Thomas Henderson
Biology
Robert Brown
John Haldane
John McCleod
Chemistry
Archibald Couper
John Cranston
William Cullen
James Dewar
Alexander Fleck
Thomas Graham
Charles Macintosh
William Ramsay
Daniel Rutherford
James Swinburne
James Waterston
James Young
Earth Sciences
James Ewing
James Hall
James Hutton
Charles Lyell
William Maclure
Roderick Murchison
William Nicol
Charles Thomson
Physics
David Brewster
James Maxwell
William Thomson
Charles Wilson
Math
James Gregory
Colin Maclaurin
John Napier
James Stirling
Joseph Wedderburn
Medicine
Charles Bell
Alexander Fleming
John Hunter
James Lind
Patrick Manson
Edward Mellanby
John Pringle
James Simpson
Robert Whytt
Technology
John Baird
Alexander Ball
Patrick Bell
James Dewar
Kirkpatrick Macmillan
John McAdams
Andrew Meikle
William Murdock
James Nasmyth
William Rankine
James Thomson
William Thomson
Robert Watson-Watt
James Watt
James Young
Denmark -- 14 Significant Figures
Astronomy
Tycho Brahe
John Dryer
Ejnar Hertzsprung
Ole Romer
Biology
Peter Dam
Johan Fabricius
Hans Gram
Wilhelm Johannsen
Chemistry
Soren Sorensen
Earth Sciences
0
Physics
Erasmus Batholin
Niels Bohr
Hans Orsted
Math
0
Medicine
Niels Finsen
Technology
Valdemar Poulsen
Norway -- 8 Significant Figures
Astronomy
0
Biology
0
Chemistry
Cato Guldberg
Earth Sciences
Jakob Bjerknes
Vilhelm Bjerknes
Peter Waage
Physics
0
Math
Niels Abel
Marius Lie
Caspar Wess
Medicine
Johannes Fibiger
Technology
0
Finland -- 1 Significant Figure
Astronomy
0
Biology
0
Chemistry
0
Earth Sciences
Johan Gadolin
Physics
0
Math
0
Medicine
0
Technology
0
Ireland -- 13 Significant Figures
Astronomy
William Parsons
Biology
John Tyndall
Chemistry
Thomas Andrews
John Bernal
Adair Crawford
Earth Sciences
Francis Beaufort
Edward Sabine
Physics
George Fitzgerald
George Stokes
George Stoney
Ernest Walton
Math
0
Medicine
0
Technology
Arthur Kennedy
Charles Parsons
Sunday, October 09, 2022
What do GSS data say about the view that many blacks do not value education?
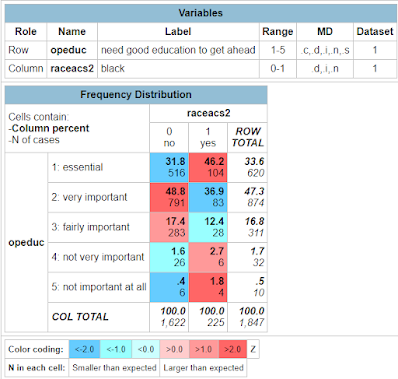
Some people argue that blacks do not perform academically as well as other groups because they lack a culture that places a high value on education. Is such a view supported by General Social Survey data? In 2021, respondents were asked, "Please show for each of these how important you think it is for getting ahead in life . . . c. Having a good education yourself?" Answers ranged from 'essential' to 'not important at all.'
The table displayed below shows the distribution of responses for blacks (raceacs = 1) and non-blacks. 46.2% of blacks say education is essential, compared to only 31.8% of others. This contradicts the claim that African Americans do not value getting an education as others do.
You might respond that blacks have been taught the importance of education, but many only pay lip service to the idea and have not internalized the attitude. If true, this points to the impotence of attempting to improve performance through teaching and stressing certain values.
Saturday, August 20, 2022
How much has mean IQ declined in the US?
I looked at General Social Survey data to see how much IQ has declined in the US since the early 70s when the GSS was started. I set whites tested in the 70s to a mean of 100, so they are the comparison group. Here's what I found:
Mean IQ for the 2010s is 99.6, so compared to 1970s whites, the mean has dropped very little. It didn't drop more since we see a Flynn effect among all racial groups. The negative impact occurs because of the tremendous growth of Hispanics who have a 2010s mean IQ of 94 shown below. (All numbers exclude immigrants since they are likely to do poorly on an English-language IQ test).
Thursday, May 19, 2022
How strongly does religiosity predict fertility?
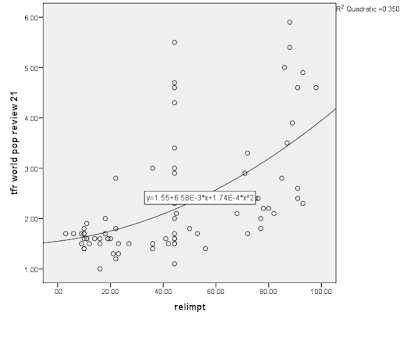
The total fertility rate in the US has fallen to 1.7. That means the average woman will have fewer than two children, not enough to replace the population. Does greater religiosity predict fertility, and if so, how strongly? I organized data on the total fertility rate (TFR)(World Population Review, 2021 data) and the percent of the country thinking religion is important (World Values Survey, various years) for 78 countries. The Spearman rank correlation is .61 (p < .001), which means that religiosity strongly predicts higher fertility. Here is a scatterplot:
Here is the scatterplot with country labels:
If we assume that a TRF of at least 2.1--replacement level--is best, then a country evidently needs close to half or more of the population believing that religion is important.
Monday, May 16, 2022
Are mass shootings on the rise because young men no longer believe in hell?
According to Steve Sailer, the mass shootings committed by disciplined, skilled killers are on the rise because fewer young men fear there is a hell waiting for them. Do the data support this?
The General Social Survey asked respondents, "Do you believe in hell?" I lumped those who answered "definitely yes" and "probably yes" into one group, and the same for the no's. Here are the results for men ages 18-29:
The percent not believing in hell bounces around a little 1991-2008, but it jumps up to 47% in 2018.
Here is a graph of the trend in high body count mass shootings in America--the type usually committed by the kind of men Steve is talking about:
The rate accelerates around the same time we see a jump in skepticism about hell.
Tuesday, May 10, 2022
Have liberals veered left on abortion?
Political parties have gotten more polarized in the past few years. Is this true for abortion attitudes, too? Using General Social Survey (GSS) data, I created the following graphs:
Liberal Women
In 2006, 60% of self-described liberal women favored abortion for any reason. That number grew and jumped from 2018 to 2021. It's now 88%.
Liberal Men
We see the same trend for liberal men. By 2021, the percent in favor was 79%. Currently, few liberals have a problem with unrestricted abortion.
Moderate Women
It's trended up for moderate women as well. They are now at 54%
Moderate Men
Moderate men are now at 57% approval.
Conservative Women
By contrast, attitudes among conservative women have stayed fairly steady, the current level of approval is at 27%.
Conservative Men
The story is similar for conservative men. They are currently at 34% approval. Overall, conservatives have not changed much, whereas liberals have veered left on the issue, especially in the last few years. There is more consensus among liberals than conservatives.
Thursday, December 23, 2021
Is "Latino Lover" a thing?
I was watching "Being the Ricardos" last night, and one of the film's themes was Desi Arnaz' infidelities. It made me wonder if there is any truth to the stereotype of the Latin lover.
The General Social Survey asked married men if they had ever cheated on their spouse. Here are the percentages (N = 4,243):
Percent of married men who have cheated
Non-Hispanic black 25.2
Black Hispanic 20.0
White Hispanic 16.9
Non-Hispanic white 16.3
Hispanic--other race 15.0
Non-Hispanic--other race 13.9
I calculated percentages for each race because I know it is relevant for infidelity. There is evidence here that black men cheat more than other groups, but rates are not high for Hispanics.
Tuesday, December 14, 2021
The 2021 General Social Survey: How many transgenders?
The 2021 General Social Survey is out. Respondents were asked their gender. Here are the results:
I am interested in the transgender issue, but let's take notice of an important GSS fact: It is heavily skewed toward women, so you need to take this into account when looking at results that differ by gender. For example, in 2021 8.4% of men do not believe in God, but only 5.1% of women believe the same way, so an excess of women in the sample will skew the results for the total sample.
But let's focus on transgenders: They are 0.3% of the sample. This is 3 per 1,000, folks, not radically different from what I was taught in college many years ago. The figure is also similar to that of the California study that reported .35% of the state is transgender.
You do see 0.4% who don't fit into the other boxes, so there is a small percentage of confused people out there.
The GSS is a sample of adults (18+), so the apparent growth in transgenderism is occurring among teens.
Monday, August 02, 2021
What percent of Americans under 40 are Christians?
A follower on Twitter indicated that he is not Christian and wondered what percent of Americans under 40 are. Well, you know I'm a sucker for that kind of question. The General Social Survey asked people about their religious affiliation in 2018--the latest published data. Here are the results:
If we add up the numbers for Christians, we get 59%, and it's probably closer to 60% since I did not include "Other", which, for example, probably includes quite a few Mormons, who consider themselves Christians and restorationists, not Protestants. If we we create a table with adults 40 and over we get this:
Added up, 78.2% of older Americans are Christians, so the percentage among young people is dramatically lower. It's not a coincidence that many young people also favor socialism.
Thursday, June 10, 2021
Is skin tone correlated with job prestige?
The General Social Survey rated the skin darkness of a sample of black Americans, ranging from "very dark brown" to "very light brown." Biologically oriented researchers might see the question as a rough measure of the percentage of European ancestry, while sociologists would see it as a measure of discrimination--lighter-skinned blacks getting better treatment. Respondents were also given a job prestige score that ranges from 16 to 80--16 is a shoeshine and 80 is a physician. Here are the job prestige means listed by skin tone:
You can see that average job prestige tends to rise with lighter skin. The mean for blacks with "very light brown" skin is roughly two-thirds of a standard deviation higher than the mean for "very dark skin" blacks.
The pattern can be interpreted in at least two ways: 1) genetic--blacks with more European ancestry tend to rise in the status hierarchy much more than African blacks, or 2) sociological--whites discriminate more against darker blacks, and perhaps light-skinned blacks have white (privileged) relatives who gave them advantages.
For several reasons, I'm inclined toward the genetic explanation. For one, my experience is that when a white person is interacting with a black person, his thought is, "I'm talking with a black person," not, "I'm talking with a light-skinned black person." For another, how do those Nigerian immigrants do so well in the US when their skin tends to be so dark? The sociologist would predict severe discrimination. The biologist would argue that African immigrants are a select group of Africans--above average in IQ and drive--and this overwhelms any bias they might experience.
Monday, May 17, 2021
Do blacks and whites who grow up equally wealthy end up with the same mean IQ?
Some people argue that mean IQs for whites and blacks differ because blacks tend to come from poorer families. A black kid raised with resources equal to a white kid will have the same IQ. Is this the case?
Using data from the General Social Survey, I calculated mean IQ for blacks, whites, and others for several ranges of father's socioeconomic index (SES): 1-2 standard deviations (sd) below average, 1 sd below average to average, average to 1 sd above average, 1-2 sds above average, and over 2 sds. The sample size is 12,016 (immigrants were excluded). Here's a graph that summarizes the results:
Blacks and whites raised at the same SES level do not have the same mean IQs. The higher white average ranges from about 7 points among the poorest group to more than 10 points among the wealthiest group. By the way, other non-whites--mostly Hispanics--are closer to blacks than whites.
Sunday, May 16, 2021
Who is more likely to be murdered by a black offender: a white or an Asian?
Wilfred Reilly (@wil_da_beast630) has a discussion going on at Twitter about which race currently faces the most "systemic racism." Some people are assuming that Asians are victimized by blacks more than whites are. Two sources of data are not very helpful here: hate crimes and victimization data from the National Crime Victimization Survey. Hate crimes are a tiny drop in the bucket of all violence, and you don't see NCVS tables with Asian victims by race of offender. (Let me know if I've missed them.) Victim data in general indicates that Asians face low levels of victimization, which makes sense because most crime is intra-racial, and Asians have very low rates of criminal offending.
Perhaps homicide data is the best way to go here. I looked at expanded FBI homicide data and the Census to calculate rates for being murdered by a black person for two groups: 1) Whites/Hispanics, and 2) Asians/ Native Americans/Pacific Islanders. I'm afraid the FBI lumps people together that way. The rate for group 1 is 2.30 murders per 1 million population. For group 2, it's 1.44 murders per million. According to FBI data, blacks pose more of a threat to whites and Hispanics than Asians plus.
Monday, May 03, 2021
Which low IQ groups have low arrest rates?
DGo (@Go321) on Twitter wondered which lower IQ groups still manage to be well-behaved as groups. Criminality is a decent measure of behavior, so I looked at General Social Survey data to see which groups with low average IQs also have lower than average arrest rates:
The percent arrested for the whole country is 12.7%. The groups listed above with an arrest rate lower than that are: Filipinos, West Indians, and Non-Spanish West Indians. And let me add that these three groups have IQ means that are not very low: 96.7, 98.8, and 95.9, respectively.
Most lower-IQ groups have high arrest rates, as expected.
UPDATE: After checking, I see that Arabs do not have a low mean IQ: it's 102.
Sunday, May 02, 2021
It's a clean sweep: IQ is more predictive of education, income, and job prestige than dad's social class
Someone at Twitter, I forget now, wondered if IQ or one's social class was more important for adult success. Well, the General Social Survey can help with this. I threw in basic demographics as controls.
Here are OLS results for income:
Looking at the betas, you can see that IQ is more strongly predictive of income than father's socioeconomic status (PASEI). Notice how race is not statistically significant when IQ is included in the model.
And job prestige?
IQ is much more predictive of job prestige than father's PASEI.
The results for education should be even stronger for IQ:
The beta for IQ is much larger than for dad's social class. How far one goes in school depends much more on brains than dad's wallet (or his other influences).
Friday, April 30, 2021
An updated analysis of the 2020 election: CPS data
In December, I posted data that make me skeptical about the integrity of the 2020 election. This is an update with new data.
In the December analysis, I reported that 158.4 million voted for US President but based on an estimate derived from the Current Population Survey (CPS), only 158.1 million were registered. Impossible. The CPS didn't have current data in December. Now they do, and they report that 168.3 million were registered in November 2020. This stunned me since the CPS estimated only 153.1 million in November 2018, so total registrations increased 15.2 million in only two years, 2018-20. For context, here's the total number registered by year since 1968:
Total number registered to vote (in millions)
1968 86.6
1972 98.5
1976 97.8
1980 105.1
1984 116.1
1988 118.6
1992 126.6
1996 127.7
2000 129.5
2004 142.1
2008 146.3
2012 153.2
2016 157.6
2018 153.1
2020 168.3
The biggest four-year increase was 2000-2004 with 12.6 million additional registrations. Such a big increase makes the 10.7 million 2016-2020 plausible, but it's weird that the total went from 157.6 million in 2016 down to 153.1 million in 2018, then it increased 15.2 million in only two years, a bigger increase than any 4-year increase since 1968! Weird but possible. By the way, the margin of error for the CPS is less than a million.
168.3 million registered people in November 2020 means 94.1% of registered voters voted for President. Election experts say that 90-95% of registered voter voting is indicative of election fraud. Countries like Australia that mandate voting can't get 94% of registered voters to vote.
For context, here are the percentage of registered voters who voted going back to 1960:
Percent of registered voters who voted
1960 107.8
1964 95.1
1968 89.4
1972 79.8
1976 77.7
1980 76.5
1984 74.6
1988 74.5
1992 71.2
1996 65.9
2000 67.5
2004 70.0
2008 89.8
2012 84.3
2016 86.8
2020 94.1
The years 1960 and 1964 look screwy, but the only other year that looks suspicious is 2020. I'm still not convinced that there was not enough funny business to change the election outcome.
By the way, according to CPS, 154.6 million people said they voted. According to the official count, 3.8 million additional votes were cast.
Sunday, March 21, 2021
What predicts virginity among young American men?
According to the General Social Survey, 28% of American men under 30 report not having sex since they turned 18. I was baffled by that and wanted to know what predicts virginity among young men.
Using General Social Survey data, I looked at a long list of possible predictors but found that most factors are unrelated. As you can see below, being younger predicts virginity (not surprisingly). More educated men are more likely to be virgins which cuts against the claim that high-status men are the ones who get sex. (Income and job prestige were not predictive.)
Never going to bars and not watching an X-rated film in the past year predicted virginity. So porn doesn't look like a substitute for sex: sexually active men are more likely to watch porn. Perhaps celibate men tend to have lower levels of testosterone? Men who go to bars are more likely to have sex, so men who make an effort or who are more social are more likely to have sex.
The GSS doesn't have many personality-type questions, so I wasn't able to look at traits like introversion or social awkwardness, but if you've got other ideas for unconventional variables, let me know.
Tuesday, March 02, 2021
Which white groups have noticeably low IQs?
To answer this question, I calculated mean IQs for all self-described whites by the country they said their ancestors came from. Only people born in the US are included since immigrants are at a disadvantage on a vocabulary test (the measure of IQ used here). Here are the results:
Mean IQ
Africa 93.4
Mexico 90.0
Puerto Rico 93.2
Spain 97.2
American Indian 94.7
India 95.8
Other Spanish 95.9
American only 90.4
It looks like many of these people are racially mixed. They label themselves as white but often have some non-white ancestry. The mixed groups that do not have low mean IQs are self-described whites whose ancestors came from east Asian countries--Japan, China, or the Philippines.
UPDATE: The mean IQ for self-described whites whose ancestors are from east Asia is 99.8.
Sunday, February 21, 2021
Is Douthat right that Rush ruined the GOP?
Ross Douthat wrote in the NYT recently that the declining appeal of the GOP is the fault of Rush Limbaugh. He claims that Republicans were a 55% proposition during the Reagan Era because the message of conservatism was preached by well-bred men like William F. Buckley. Rush came along and turned conservatism into something angry and strident and that only appeals to 45% of voters.
If Ross is correct, we should see greater support for Reagan among racial minorities--the groups we have a hard time winning over. After all, Buckley was a leading advocate for conservatism during that time and Rush was unknown.
Using the General Social Survey, we can compare minority deficits over time. I calculate this as the percent of a racial minority voting for the GOP presidential candidate minus the percent of all voters who cast a vote for the Republican candidate.
Minority deficit
1980
Blacks -39.2
Mexicans -18.2
1984
Blacks -48.3
Mexicans -19.5
Damn, impressive: under Buckley and Reagan sophistication, Blacks and Mex-Ams supported the GOP by only 18 to 48 points less than the general population! The power of positivity!
And since then? Bush Sr. wasn't strident. Perhaps he did better.
1988
Blacks -41.9
Mexicans -26.2
1992
Blacks -34.6
Mexicans -18.1
1996
Blacks -26.2
Mexicans -12.1
The numbers are slightly less bad with grumpy Dole.
2000
Blacks -42.5
Mexicans -6.5
It looks like angry Rush didn't chase away Mex-Ams in 2000.
2004
Blacks -37.6
Mexicans -11.7
2008
Blacks -34.7
Mexicans -15.3
2012
Blacks -33.3
Mexicans -17.8
2016
Blacks -38.2
Mexicans -19.7
The Republicans did no better among minorities before strident Rush became influential in the early 1990s.
Douthat ignores the obvious: the GOP is struggling because there were fewer than 20 million Hispanics during the Reagan Era. In 2021, there are more than 60 million--and this perennially poor group likes generous social programs and is susceptible to anti-white propaganda like all non-white groups. And probably will be for a very long time.
Friday, February 19, 2021
Which religion has the most forgiving people?
The General Social Survey asked respondents if it is true that: "I sometimes try to get even rather than forgive and forget." Below you see the answers by religious affiliation.
All groups have higher rates of vengefulness than Christians, including the "nones." This makes sense since Christianity stresses forgiveness.
Among Christians, those that attend church all the time are the most forgiving.
And nowadays many of the people with no religion like to accuse devout Christians of being the haters.
Are gun owners mentally ill?
Some anti-gun people think owning a gun is a sign of some kind of mental abnormality. According to General Social Survey data, gun owners ...
-
Via a reader at iSteve, it looks like this might be the vocabulary test used by the General Social Survey. (Someone please tell me if I'...
-
In the comments in the last post , some readers contended that Jews are not ethnocentric. Using the same question I used in the comments se...
-
Here's the second set I promised. A reader suggested that the first set tends to be older, and it is among younger blacks where you see ...