The question came up over at Steve Sailer's blog if Jewish women are more likely than other women to be lesbian. It wouldn't surprise me since data reported on this blog indicate that lesbians tend to be smarter than average, and they are more likely to come from wealthy homes. According to GSS data, here are the percentages of women by religion who say they are lesbian (sample size = 10,981):
Percent lesbian
Protestant 1.8*
Catholic 1.6*
Jewish 1.4
No religion 4.0
*significantly less than the no religion group
No evidence here for more Jewish lesbians.
From what I hear, straight Jewish women are plenty good at denying men sex.
Wednesday, April 11, 2012
Sunday, April 08, 2012
The link between intelligence and cooperativeness
In a sample of almost 4,500 men, a positive correlation (.23) was observed between general intelligence and the general factor of personality (GFP). GFP captures one's ability to work well with others. According to the authors, general intelligence evolved to generate more resources while GFP evolved to secure a larger share of group resources.
The positive correlation suggests four types of people, two of which are more common and two of which are less uncommon. The more frequent types are smart-cooperative and dull-uncooperative people. Less common are smart-uncooperative and dull-cooperative folks.
The positive correlation suggests four types of people, two of which are more common and two of which are less uncommon. The more frequent types are smart-cooperative and dull-uncooperative people. Less common are smart-uncooperative and dull-cooperative folks.
Friday, April 06, 2012
Disliking races might be a personality trait
The GSS asked respondents how warmly they feel about: 1) whites, 2) blacks, 3) Hispanics, and 4) Asians. Answers ranged from very cool to very warm. I correlated answers for whites. The mean correlation is .63. While there is substantial range--from .45 for white-white to .81 for Asian-Hispanic--the main story here is that if a person dislikes one group, he tends to have comparatively cool feelings for all groups, even his own. I found the same basic results when I limited the analysis to the black sample or a sample of those of some other race.
We can construct a typology here for all races. Roughly half feel warmly toward all races. Thirty percent or so are neutral toward everyone. Fifteen percent like their group but dislike everyone else, and five percent can't stand anybody. The consistent attitude for various groups leads me to think one's disposition toward groups is a personality trait. It's probably related to one's attitude toward people in general: trusting and warm versus suspicious and hostile.
We can construct a typology here for all races. Roughly half feel warmly toward all races. Thirty percent or so are neutral toward everyone. Fifteen percent like their group but dislike everyone else, and five percent can't stand anybody. The consistent attitude for various groups leads me to think one's disposition toward groups is a personality trait. It's probably related to one's attitude toward people in general: trusting and warm versus suspicious and hostile.
Tuesday, April 03, 2012
Father's social class and homosexuality
Using GSS data, I calculated the mean father's socioeconomic index for women who are straight, bisexual, and lesbian (sample size = 8,551).
Mean Father's Socioeconomic Index
Straight 47.3
Bisexual 50.4
Lesbian 52.7*
*significantly higher than straight women
Compared to straight women, lesbians come from significantly higher status families. And for men (sample size = 7,867):
Mean Father's Socioeconomic Index
Straight 48.2
Bisexual 50.1
Gay 49.3
Gay men do not come from significantly higher status homes than straight men.
I'm not sure how to explain the pattern. Women from higher class homes might be more willing to admit lesbianism or might be more willing to adopt a lesbian orientation. There is evidence that lesbianism is more environmentally influenced than homosexuality. One might suggest that higher status fathers are more masculine (at least in some ways) and more likely to have masculine daughters.
Mean Father's Socioeconomic Index
Straight 47.3
Bisexual 50.4
Lesbian 52.7*
*significantly higher than straight women
Compared to straight women, lesbians come from significantly higher status families. And for men (sample size = 7,867):
Mean Father's Socioeconomic Index
Straight 48.2
Bisexual 50.1
Gay 49.3
Gay men do not come from significantly higher status homes than straight men.
I'm not sure how to explain the pattern. Women from higher class homes might be more willing to admit lesbianism or might be more willing to adopt a lesbian orientation. There is evidence that lesbianism is more environmentally influenced than homosexuality. One might suggest that higher status fathers are more masculine (at least in some ways) and more likely to have masculine daughters.
Sunday, April 01, 2012
Predictors of anti-Semitism
GSS respondents were asked to give a number between 0 and 100 that describes their feelings toward Jews. They were told that 0 to 50 indicates not being favorable to and not caring for Jews, while 50 to 100 indicates feeling favorable and warm. Among a sample of 4,487, 12.1% gave a number under 50. Multiple regression reveals which factors predict liking Jews:
Standardized OLS Regression Coefficients
Age .098
Sex .069
Race .059
Size of place -.037
South -.021
Education .071
Income .057
Church attendance .144
Political conservatism -.009
All predictors are significantly related to liking Jews with the two exceptions of conservatism and living in the South. Focusing on the negative, here are the characteristics of people more likely to dislike Jews: young, male, non-white, urban, uneducated, poor, and irreligious. The strongest predictor is religiosity. Age and education are also important. It surprises me that people who are young and urban are more likely to be anti-Semitic.
I didn't include IQ as a predictor since it is collinear with education, but if it takes the place of educational level, it is a comparatively strong predictor of liking Jews (the coefficient is .177).
Standardized OLS Regression Coefficients
Age .098
Sex .069
Race .059
Size of place -.037
South -.021
Education .071
Income .057
Church attendance .144
Political conservatism -.009
All predictors are significantly related to liking Jews with the two exceptions of conservatism and living in the South. Focusing on the negative, here are the characteristics of people more likely to dislike Jews: young, male, non-white, urban, uneducated, poor, and irreligious. The strongest predictor is religiosity. Age and education are also important. It surprises me that people who are young and urban are more likely to be anti-Semitic.
I didn't include IQ as a predictor since it is collinear with education, but if it takes the place of educational level, it is a comparatively strong predictor of liking Jews (the coefficient is .177).
Sunday, March 25, 2012
Interracial murder
The Trayvon Martin case is an opportunity to remind people of the reality of interracial crime in the United States.
For the purposes of this analysis, I'll use the term "whites" to refer to whites plus Hispanics since they get lumped together in the data. According to FBI data for 2010, 218 blacks were murdered by whites. Blacks murdered 447 whites. But this is comparing apples and oranges since whites are 6.4 times the size of the black population. If we calculate murders per 10 million in the race-specific population (interracial murder is rare), the rate is 8.82 for whites and 114.89 for blacks. So blacks kill whites at a rate 13 times higher than that of whites killing blacks.
Another way to look at it is multiply the black population by 6.4 to make it as large as whites. If it were as large, 2861 whites would have been murdered compared to the 218 blacks killed by whites.
For the purposes of this analysis, I'll use the term "whites" to refer to whites plus Hispanics since they get lumped together in the data. According to FBI data for 2010, 218 blacks were murdered by whites. Blacks murdered 447 whites. But this is comparing apples and oranges since whites are 6.4 times the size of the black population. If we calculate murders per 10 million in the race-specific population (interracial murder is rare), the rate is 8.82 for whites and 114.89 for blacks. So blacks kill whites at a rate 13 times higher than that of whites killing blacks.
Another way to look at it is multiply the black population by 6.4 to make it as large as whites. If it were as large, 2861 whites would have been murdered compared to the 218 blacks killed by whites.
Saturday, March 24, 2012
Predictors of racism
As a follow-up to the last post, let's do multiple regression to see which factors predict feeling cool toward blacks (sample size = 958 whites):
Coolness toward blacks (standardized OLS coefficients)
Age .088*
Sex -.096*
Size of place -.036
South .025
Education -.011*
Income -.027
Church attendance -.105*
Political conservatism .082*
*p < .05, two-tailed
So cooler feelings are associated with being: older, male, less educated, less religious, and more conservative. Population size, income, and being from the South do not matter.
And here is the model for blacks feeling cool toward whites (sample size = 117):
Coolness toward whites (standardized OLS coefficients)
Age -.003
Sex .013
Size of place .239*
South .109
Education -.134
Income .077
Church attendance .106
Political conservatism .114
*p < .05, two-tailed
Living in a more populated area is the only significant predictor of coolness among blacks. The sample size is small, so if we ignore significance and focus on the size of the cooefficients, it looks like the following are associated with not liking whites: living in the South, less education, more income, more church attendance, and more political conservatism. Age and sex don't seem to matter. It's interesting that church seems to discourage racism among whites but encourage it among blacks.
Coolness toward blacks (standardized OLS coefficients)
Age .088*
Sex -.096*
Size of place -.036
South .025
Education -.011*
Income -.027
Church attendance -.105*
Political conservatism .082*
*p < .05, two-tailed
So cooler feelings are associated with being: older, male, less educated, less religious, and more conservative. Population size, income, and being from the South do not matter.
And here is the model for blacks feeling cool toward whites (sample size = 117):
Coolness toward whites (standardized OLS coefficients)
Age -.003
Sex .013
Size of place .239*
South .109
Education -.134
Income .077
Church attendance .106
Political conservatism .114
*p < .05, two-tailed
Living in a more populated area is the only significant predictor of coolness among blacks. The sample size is small, so if we ignore significance and focus on the size of the cooefficients, it looks like the following are associated with not liking whites: living in the South, less education, more income, more church attendance, and more political conservatism. Age and sex don't seem to matter. It's interesting that church seems to discourage racism among whites but encourage it among blacks.
What percent of whites don't like blacks?
I have a white friend who is married to a black woman. "Converts make the best zealots" certainly applies to this guy. He rants constantly that George Zimmerman proves that white racism is still alive and well. After reminding him that Zimmerman is Hispanic and that anecdote is the weakest form of evidence, I bring out the big guns: the General Social Survey.
Respondents were asked in 2002 how warmly or cooly do they feel towards blacks as a group. Answers ranged from "very warm" (1) to very cool (9). Among whites (sample size = 2162), only 11.4% percent gave a cool answer (answers 6-9). Only 2.3% said "very cool." (Blacks were asked the same question, and 5.9% gave a cool answer for fellow blacks.)
Next, I calculated median education and income for whites giving cool answers. It is 12.0 years of school and the income range between $25,000 and $29,999. So whites that don't like blacks are, on average, uneducated, and they have low status jobs. They don't run anything and so are in no position to deny blacks jobs, etc.
While we're at it, 15.6% of blacks (sample size = 405) feel cool toward whites. Four percent answered "very cool." And the share of whites who are cool toward whites: 4.7%.
Respondents were asked in 2002 how warmly or cooly do they feel towards blacks as a group. Answers ranged from "very warm" (1) to very cool (9). Among whites (sample size = 2162), only 11.4% percent gave a cool answer (answers 6-9). Only 2.3% said "very cool." (Blacks were asked the same question, and 5.9% gave a cool answer for fellow blacks.)
Next, I calculated median education and income for whites giving cool answers. It is 12.0 years of school and the income range between $25,000 and $29,999. So whites that don't like blacks are, on average, uneducated, and they have low status jobs. They don't run anything and so are in no position to deny blacks jobs, etc.
While we're at it, 15.6% of blacks (sample size = 405) feel cool toward whites. Four percent answered "very cool." And the share of whites who are cool toward whites: 4.7%.
Wednesday, March 21, 2012
A black-white difference in cortisol level

A new study from Homones and Behavior reveals a black-white difference among children in cortisol levels throughout the day. A flatter diurnal slope is associated with more chronic stress and health problems.
As shown in the graph, whites wake up with a significantly higher level which then falls more quickly throughout the day. The different slope remains even when the following factors are controlled: age, gender, non-steroid medication usage, sleep, wake time, socioeconomic risk, psychosocial risk, perceived discrimination, harsh parenting, and parental monitoring.
Compared to blacks, the slope for Hispanics is more similar to whites, although Hispanics do have lower cortisol levels than whites by evening time.
The authors suggest that since morning levels of cortisol are known to be influenced by genes, the racial difference might be due, in part, to genetic differences.
Tuesday, March 20, 2012
IQ is more important than social class

This is a structural equation model of a cohort of Swedish men. It shows that IQ is an important determinant of income and especially occupational position. Much of its influence is indirect: it is a strong predictor of educational level which, in turn, is a powerful determinant of both income and especially occupational position. Parent's social class, by contrast, is comparatively less important. It has little to no direct influence on income or job position, and predicts educational level only moderately.
A whole academic field--sociology--developed on the view that social class is of critical importance. If disciplines emerged as a result of empirical support, students could major in IQiology.
Sunday, March 11, 2012
Why do wealthy white conservative women have more children?
In the recent post on the fertility of wealthy white women, a reader raised the question of why conservative women have more children. He suggested it was greater religiosity and less involvement in the workplace.
We can use OLS regression analysis to help answer the question. I included white women ages 40-59 in households earning at least $100k in 1986 dollars. First, I regressed the number of offspring onto political orientation. The unstandardized coefficient is .161 (p < .05) which indicates that conservative women have significantly more babies. If we include church attendance, the coefficient drops to .120. If, instead, we include hours worked last week, the political coefficent drops to .132. If, instead, we include years of schooling completed, the political slope falls to .131. (The correlation between education and conservatism among wealthy white women is -.16--liberals tend to be more educated.) If all three controls are included in the model, the results look like this:
Number of offspring (sample size = 231)
Conservatism .081
Church attendance .098*
Hours of work -.007
Education -.081*
*p < .05, two-tail
With the three controls included, the link between poltical views and number of offspring falls to non-significance. In this full model, number of hours worked also has no significant effect on fertility. To put it in plain English, the data indicate that wealthy white conservative women have more children because they are more religious and less educated than liberal women.
One caution: education's effect is not the influence of IQ. Among this demographic, IQ is unrelated to fertility. The correlation between IQ and number of kids is .02--basically zero. Education's influence appears to be cultural.
We can use OLS regression analysis to help answer the question. I included white women ages 40-59 in households earning at least $100k in 1986 dollars. First, I regressed the number of offspring onto political orientation. The unstandardized coefficient is .161 (p < .05) which indicates that conservative women have significantly more babies. If we include church attendance, the coefficient drops to .120. If, instead, we include hours worked last week, the political coefficent drops to .132. If, instead, we include years of schooling completed, the political slope falls to .131. (The correlation between education and conservatism among wealthy white women is -.16--liberals tend to be more educated.) If all three controls are included in the model, the results look like this:
Number of offspring (sample size = 231)
Conservatism .081
Church attendance .098*
Hours of work -.007
Education -.081*
*p < .05, two-tail
With the three controls included, the link between poltical views and number of offspring falls to non-significance. In this full model, number of hours worked also has no significant effect on fertility. To put it in plain English, the data indicate that wealthy white conservative women have more children because they are more religious and less educated than liberal women.
One caution: education's effect is not the influence of IQ. Among this demographic, IQ is unrelated to fertility. The correlation between IQ and number of kids is .02--basically zero. Education's influence appears to be cultural.
Thursday, March 08, 2012
Sexual selection and small female feet
This new study in Evolution and Human Behavior provides evidence that the smaller female foot length to body length ratio is due to intersexual selection. Evidently, men perceive small feet to be more attractive since they are associated with youth and thus greater potential fertility.
Sunday, March 04, 2012
Fertility among wealthy white liberal and conservative women
The issue of fertility among wealthy conservative and liberal white women was raised at Steve Sailer's blog. I calculated the mean number of children for the two groups (ages 40-59, households making at least 100k in 1986 dollars):
Mean number of offspring
Wealthy liberal women (n = 35) 1.60
Wealthy conservative women (n = 43) 2.49
The difference is statistically significant. Wealthy white conservative women average 55 percent more kids than their liberal counterparts.
Mean number of offspring
Wealthy liberal women (n = 35) 1.60
Wealthy conservative women (n = 43) 2.49
The difference is statistically significant. Wealthy white conservative women average 55 percent more kids than their liberal counterparts.
Are moderates smart?
The media gives the impression that only moderate Republicans are intelligent. The truth is that the dumbest spot on the political continuum is the center.
Using data on the GSS vocabulary test, I created an IQ score for all respondents. I've listed the mean IQ for those who voted for McCain, Obama, and those who describe themselves as moderates (sample size = 944).
Mean IQ
McCain 102.28
Obama 100.06
Moderates 97.72
The difference between people who voted for McCain and self-described moderates is statistically significant.
Using data on the GSS vocabulary test, I created an IQ score for all respondents. I've listed the mean IQ for those who voted for McCain, Obama, and those who describe themselves as moderates (sample size = 944).
Mean IQ
McCain 102.28
Obama 100.06
Moderates 97.72
The difference between people who voted for McCain and self-described moderates is statistically significant.
Thursday, March 01, 2012
Catholics are NOT social conservatives
I scratch my head every time pundits refer to Catholics as social conservatives. As a group, they simply are not. Exit polls show that in the Michigan primary a plurality of Catholics voted for Romney, not Santorum. The church has little influence over parishioners.
Tuesday, February 28, 2012
Hispanics in the Arizona primary
How exactly does the Republican candidate who talks the toughest against illegal immigration get the highest share of Hispanic votes in the Arizona primary? I suspect that Hispanics are not quite as race-faithful as liberals wish they were. Not to worry, folks: they'll vote for you anyway because that's what perennially poor people do.
Thursday, February 23, 2012
Do blacks value education?
Elites, even many conservatives, think racial preferences are justified because blacks are disadvantaged due to a lack of culture which puts a premium on education. Bill O'Reilly said exactly that on his show tonight.
From the data I've seen, blacks as a group think getting educated is very important. The GSS asked respondents to list in order of importance those factors that should be used to determine an employee's pay. Only 103 blacks were asked this question, so I merged those who listed education as either first or second most important:
Percent thinking education is important for determining pay (sample size = 1,090):
Blacks 29.1
Whites 22.2
School teachers 24.1
More blacks think education is valuable than whites or even teachers.
From the data I've seen, blacks as a group think getting educated is very important. The GSS asked respondents to list in order of importance those factors that should be used to determine an employee's pay. Only 103 blacks were asked this question, so I merged those who listed education as either first or second most important:
Percent thinking education is important for determining pay (sample size = 1,090):
Blacks 29.1
Whites 22.2
School teachers 24.1
More blacks think education is valuable than whites or even teachers.
Tuesday, February 21, 2012
Race and sex differences in infant digit ratios
This recent study examined 2D:4D digit ratios for 364 infants from birth through the second birthday. (Digit ratios are thought to reflect prenatal exposure and/or sensitivity to testosterone.) Six measures were taken: during the first month, the first and second birthdays, and both the left and right hands at each visit. I averaged the six measures for both boys and girls: Cohen's d for the difference between the boys'and girls' means is .167--a small difference.
The authors gave Cohen's d for the black-white differences for each of the six measures. I averaged them and got .383--a moderate difference with blacks being more masculinized. (The number might be an underestimate because they ignored the fathers and based racial classification on the mother's race alone. Mixed-race babies might have blurred the difference.) Anyway, in this study of prenatal testosterone, the size of the racial gap is more than double the gender gap.
The authors gave Cohen's d for the black-white differences for each of the six measures. I averaged them and got .383--a moderate difference with blacks being more masculinized. (The number might be an underestimate because they ignored the fathers and based racial classification on the mother's race alone. Mixed-race babies might have blurred the difference.) Anyway, in this study of prenatal testosterone, the size of the racial gap is more than double the gender gap.
Sunday, February 19, 2012
Racial differences in childhood myopia
There is a stereotype of the nerdy Asian or white kid with thick glasses, but research presents a more complex picture of myopia (nearsightedness). Based on three studies of children (most are 11 or under) (here, here, and here), prevalence rates look like this:
Myopia prevalence among children
Chinese (Singapore) 40.1
Indians (Singapore) 34.1
Chinese (Malaysia) 30.9
South Asians (British) 25.2
Malays (Singapore) 22.1
Asian Americans 18.5
Hispanic Americans 13.2
Indians (Malaysia) 12.5
Black African Caribbeans (British) 10.0
Malays (Malaysia) 9.2
Black Americans 6.4
White Americans 4.4
British whites 3.4
So the ranking goes: Asians, Hispanics, blacks, and whites on the bottom--not quite the stereotype.
UPDATE: It looks like the black-white gap reverses by adulthood. More later...
Myopia prevalence among children
Chinese (Singapore) 40.1
Indians (Singapore) 34.1
Chinese (Malaysia) 30.9
South Asians (British) 25.2
Malays (Singapore) 22.1
Asian Americans 18.5
Hispanic Americans 13.2
Indians (Malaysia) 12.5
Black African Caribbeans (British) 10.0
Malays (Malaysia) 9.2
Black Americans 6.4
White Americans 4.4
British whites 3.4
So the ranking goes: Asians, Hispanics, blacks, and whites on the bottom--not quite the stereotype.
UPDATE: It looks like the black-white gap reverses by adulthood. More later...
Friday, February 17, 2012
More on the black-white difference in sexual dimorphism
Reader Fenris suggests that if I am interested in black-white differences in sexual dimorphism, I shouldn't look at indirect measure like life expectancy, but should investigate height differences. I thought I had done it previously, but turns out that it was blacks and Asians that I compared before.
To make the best comparison, it makes sense to look at populations with environments that are as equal as possible. How about young blacks and whites measured recently? In fact, the data indicate that racial differences have reversed in the U.S. over time. I used Fenris' source and also found a newer one.
Here is the black sex difference in height minus the white sex difference for different age groups and periods:
Ages 40-59 (1988-94) -1.4 cm
Ages 20-39 (1988-94) -.2 cm
Ages 20-39 (2003-06) +.7 cm
As conditions have improved for blacks, their sexual height difference has changed from being smaller than that of whites to becoming larger.
To make the best comparison, it makes sense to look at populations with environments that are as equal as possible. How about young blacks and whites measured recently? In fact, the data indicate that racial differences have reversed in the U.S. over time. I used Fenris' source and also found a newer one.
Here is the black sex difference in height minus the white sex difference for different age groups and periods:
Ages 40-59 (1988-94) -1.4 cm
Ages 20-39 (1988-94) -.2 cm
Ages 20-39 (2003-06) +.7 cm
As conditions have improved for blacks, their sexual height difference has changed from being smaller than that of whites to becoming larger.
Monday, February 13, 2012
Jews and vegetarianism
OneSTDV and Half Sigma have been writing about the link between Jews and vegetarianism. That made me wonder if: 1) Jews as a group are more sympathetic toward not eating meat; and 2) if so, is it simply a reflection of their liberalism. Back when I was a liberal in college, I was a vegetarian for two years. (It sucked.)
Following Half Sigma, let's look a the GSS question, "And how often do you refuse to eat meat for moral or environmental reasons?" (This is a weird question. Most people avoid meat for putative health reasons.)
I reverse-scored the answers and regressed the numbers on whether someone is Jewish or not (sample size = 2,882). The standardized regression coefficient is .049 (p < .01) which means that Jews refuse to eat meat more often than others. Next, I looked to see if, among Jews, the tendency is related to religious commitment. The beta is .165 which suggests more abstaining with more religious service attendance (but the relationship falls short of statistical significance, probably because of the small sample--only 70 people) .
Finally, I added a measure of political orientation as a control to the model with the full sample.
Standardized Regression Coefficients
Jewish .041*
Conservatism -.097*
*statistically significant
Including political orientation does little to reduce the link between being Jewish and favoring vegetarianism, so the correlation is not just a reflection of liberalism; it appears to be a cultural difference.
By the way, I despise having to reassure people (I HATED Steven Pinker's The Blank Slate because he defended himself every other sentence) but I don't blame Jews collectively for anything, not even for Howie Mandel.
Another by the way--I really can't be too opposed to vegetarianism as an Orthodox Christian. I'm supposed to abstain from meat and dairy every Wednesday and Friday, and during fast periods like Lent. (I suppose I could blame the Jew Jesus for fasting 40 days.)
Following Half Sigma, let's look a the GSS question, "And how often do you refuse to eat meat for moral or environmental reasons?" (This is a weird question. Most people avoid meat for putative health reasons.)
I reverse-scored the answers and regressed the numbers on whether someone is Jewish or not (sample size = 2,882). The standardized regression coefficient is .049 (p < .01) which means that Jews refuse to eat meat more often than others. Next, I looked to see if, among Jews, the tendency is related to religious commitment. The beta is .165 which suggests more abstaining with more religious service attendance (but the relationship falls short of statistical significance, probably because of the small sample--only 70 people) .
Finally, I added a measure of political orientation as a control to the model with the full sample.
Standardized Regression Coefficients
Jewish .041*
Conservatism -.097*
*statistically significant
Including political orientation does little to reduce the link between being Jewish and favoring vegetarianism, so the correlation is not just a reflection of liberalism; it appears to be a cultural difference.
By the way, I despise having to reassure people (I HATED Steven Pinker's The Blank Slate because he defended himself every other sentence) but I don't blame Jews collectively for anything, not even for Howie Mandel.
Another by the way--I really can't be too opposed to vegetarianism as an Orthodox Christian. I'm supposed to abstain from meat and dairy every Wednesday and Friday, and during fast periods like Lent. (I suppose I could blame the Jew Jesus for fasting 40 days.)
Sunday, February 12, 2012
Are blacks more sexually dimorphic than whites?
We know that some species are more sexually dimorphic than others. Species with big differences are polygamous and are called "tournament" species (due to the intense male-male competition) while those with small sex differences are monogamous and are called "pair-bonding" species. (Small) differences might exist across human races as well.
One indication of the degree of dimorphism is the gender difference in life expectancy. According to the NCHS, current life expectancy is 80.6 years for (non-Hispanic) white females and 75.8 years for white males. So among whites, women live 4.8 years or 6.3 percent longer. Expectancies among (non-Hispanic) blacks are 76.5 for women and 69.6 for men. So black women live 6.9 years or 9.9 percent longer. I take this as evidence that blacks are more sexually dimorphic than whites. (Keep in mind that racial differences are reduced since American blacks have roughly 20 percent European ancestry.)
One indication of the degree of dimorphism is the gender difference in life expectancy. According to the NCHS, current life expectancy is 80.6 years for (non-Hispanic) white females and 75.8 years for white males. So among whites, women live 4.8 years or 6.3 percent longer. Expectancies among (non-Hispanic) blacks are 76.5 for women and 69.6 for men. So black women live 6.9 years or 9.9 percent longer. I take this as evidence that blacks are more sexually dimorphic than whites. (Keep in mind that racial differences are reduced since American blacks have roughly 20 percent European ancestry.)
Thursday, February 09, 2012
Scientific views and deviant behavior
In the Folly of Fools, Robert Trivers describes experimental research which shows that people are more likely to cheat after being told that behavior is determined by a combination of nature and nurture. The idea that scientific views corrode morals made me wonder what the GSS might tell us. I looked to see if biologists are more likely to cheat on their spouse. Only 15 of them were asked about cheating, but their numbers are similar to the general population. Twenty percent of male biologists and ten percent of females have strayed. The corresponding numbers for the overall population are 23 and 14.
Tuesday, February 07, 2012
Predictors of a big penis
I doubt that many Inductivist readers want to know how to predict which men have big penises, but what the hell. In a study of 3,762 college males, a list of characteristics reflecting the level of one's masculinity was found to be positively correlated with self-reported criminality. All these factors were also intercorrelated. Here are the correlations with penis length:
Correlations
Lower body strength .386
Upper body strength .378
Amount of body hair .312
Strength of sex drive .248
Physical strength .248
Masculine mannerisms .231
Masculine body build .222
Low-deep voice .148
So forget the stuff about big hands or big feet: Look for the strong hairy dude with the deep voice. But don't forget he might be a criminal, too.
Correlations
Lower body strength .386
Upper body strength .378
Amount of body hair .312
Strength of sex drive .248
Physical strength .248
Masculine mannerisms .231
Masculine body build .222
Low-deep voice .148
So forget the stuff about big hands or big feet: Look for the strong hairy dude with the deep voice. But don't forget he might be a criminal, too.
Monday, January 30, 2012
Trivers on genes and mental traits
From Robert Trivers' The Folly of Fools:
By some estimates, more than half of all genes express themselves in the brain: that is, more than ten thousand genes. This means that genetic variation for mental and behavioral traits should be especially extensive and fine-grained in our species--contra decades of social science dogma.
Florida Hispanics don't care about illegal immigration
Here's one more bit of evidence that Hispanic "representatives" lie about their community being obsessed with the illegal immigration issue.
According to a Miami Herald poll of likely voters, Romney beats Obama by 16 points (53% v 37%) among Florida Hispanics. Now how does a Republican who says that all illegals should go home and get in the back of the line for legal permission to enter this country do so well among Latinos in Florida? Because they're mostly Cubans and Puerto Ricans who simply don't care about the illegal issue. Like other Americans, their first priority is more jobs. (Of course, Cubans care about Cuba, too.) Romney shows that you can talk tough about illegals and still win.
According to a Miami Herald poll of likely voters, Romney beats Obama by 16 points (53% v 37%) among Florida Hispanics. Now how does a Republican who says that all illegals should go home and get in the back of the line for legal permission to enter this country do so well among Latinos in Florida? Because they're mostly Cubans and Puerto Ricans who simply don't care about the illegal issue. Like other Americans, their first priority is more jobs. (Of course, Cubans care about Cuba, too.) Romney shows that you can talk tough about illegals and still win.
Saturday, January 28, 2012
Explanations of rape
Here's new research from Evolution and Human Behavior:
The findings contradict the feminist theory of rape. Given a robbery, criminals are more likely to use the opportunity to sexually assault a female victim if she is young. According to feminists, rape is a way to put a woman in her place. If this were the motivation, I would expect men to target powerful women. A criminal would get a much bigger power rush from raping Hillary Clinton than a little 15 year old nobody. I imagine the feminist would respond that Hillary is a high-risk target--perps target weak victims because they are more likely to get away with it. I would agree with the view that rapists are opportunists, but that just supports a rational choice theory of rape.
We use data from the National Incident-Based Reporting System to examine the effects of offender and victim age on whether male offenders commit sexual assault while robbing women. Restricting analyses to robberies reveals the offenders' age preferences since it allows one to control for the effects of opportunity. We find that robbers of all ages are most likely to sexually assault women at ages 15–29 years, ages when their reproductive potential is highest. However, in contrast to the idea that rape is a direct adaptation, victims are no more likely to be raped than sexually assaulted at these ages. The age of the offender is also a strong predictor of sexual assault. The likelihood that a robber commits a sexual assault increases from age 12 years until he reaches his early thirties when it begins to decline. This age pattern corresponds, to some extent, to age differences in the male sex drive.
The findings contradict the feminist theory of rape. Given a robbery, criminals are more likely to use the opportunity to sexually assault a female victim if she is young. According to feminists, rape is a way to put a woman in her place. If this were the motivation, I would expect men to target powerful women. A criminal would get a much bigger power rush from raping Hillary Clinton than a little 15 year old nobody. I imagine the feminist would respond that Hillary is a high-risk target--perps target weak victims because they are more likely to get away with it. I would agree with the view that rapists are opportunists, but that just supports a rational choice theory of rape.
Tuesday, January 24, 2012
IQ and drug use
New from the journal Intelligence:
In addition to greater openness, the results point to hedonism among smart people. The authors speculate that drug use drops among those with the highest IQs because this is a rare trait that may be socially isolating (there is a strong social component to the consumption of drugs).
One motivation for trying recreational drugs is the desire for novel experiences. More intelligent people tend to value novelty more highly and may therefore be more likely to have tried recreational drugs. Using data from a national survey, it is shown that intelligence tends to be positively related to the probabilities of having tried alcohol, marijuana, cocaine and several other recreational drugs. Evidence is also presented that those relationships typically disappear or change sign at high levels of intelligence. These patterns persist after accounting for a wide range of personal characteristics.
In addition to greater openness, the results point to hedonism among smart people. The authors speculate that drug use drops among those with the highest IQs because this is a rare trait that may be socially isolating (there is a strong social component to the consumption of drugs).
Saturday, January 21, 2012
Race and self-enhancement
Robert Trivers claims in The Folly of Fools that blacks explicitly self-enhance but subconsciously feel that they are inferior. Consistent with this blog's analyses, Trivers cites research indicating that, when asked, blacks inflate themselves more than whites. But Trivers then describes studies that show that blacks implicitly associate whiteness with goodness and blackness with undesirability. They also perform worse on IQ tests when reminded that they are black. Whites, by contrast, associate whiteness with goodness and do a bit better on tests when reminded that they are white. Trivers explains this in terms of identfying with the oppressor: to reduce conflict, victims self-deceive and adopt the view of the exploiter.
In my view, Triver's goofy leftism runs him off the rails here. The fact is that whites are not the oppresors of blacks, and have not been for several decades. It is also a fact that whites are better suited than blacks to life in a civilized society. Perhaps blacks sense this inferiority subconsciously--which is revealed in these studies of subconscious attitudes--but their excessive self-enhancement is manifested consciously. This helps explain phenomena like clownish Afro-centrism. Or perhaps the truth is as simple as whites creating a dominant culture which minorites tend to absorb because it's the water you swim in. The culture doesn't portray whites as superior, but it is mostly made by whites. You might identify with the leader, not because he is exploiting you, but because he is the leader.
For whites, their subconscious self-enhancement is most simply explained as natural: if Trivers is correct, people naturally self-enhance unless there is something to override it.
In my view, Triver's goofy leftism runs him off the rails here. The fact is that whites are not the oppresors of blacks, and have not been for several decades. It is also a fact that whites are better suited than blacks to life in a civilized society. Perhaps blacks sense this inferiority subconsciously--which is revealed in these studies of subconscious attitudes--but their excessive self-enhancement is manifested consciously. This helps explain phenomena like clownish Afro-centrism. Or perhaps the truth is as simple as whites creating a dominant culture which minorites tend to absorb because it's the water you swim in. The culture doesn't portray whites as superior, but it is mostly made by whites. You might identify with the leader, not because he is exploiting you, but because he is the leader.
For whites, their subconscious self-enhancement is most simply explained as natural: if Trivers is correct, people naturally self-enhance unless there is something to override it.
Wednesday, January 18, 2012
Do smart people lie more?
In his new book The Folly of Fools, Robert Trivers hypothesizes that smart people are more likely to tell lies. This surprised me since I usually assume that intelligent people tend to act more prosocially. According to Trivers, if you compare across species, deception increases with intelligence. Better deception and manipulation require more mental ability.
Add Health participants (teens and young adults) were given a vocabulary test and were asked how often they lie to their parents about their whereabouts. I looked at the correlation between the two questions: it is a tiny .07 (sample size = 6,168). For males, it is a bit stronger--.10--while it is .only .05 for females. So, there is a tendency for smarter youths to lie more frequently, but it is very weak.
Anecdotally, I can see that my smartest child is the most dishonest. His lies are pretty clever for a 4 year old. A few more years, and he'll probably outsmart his old man. I'd like to think that I can teach him to be more honest, but behavioral genetic research makes me less optimistic.
By they way, Trivers seems to think that bright people not only deceive more; they are also more likely to self-deceive, which is contrary to what most intelligent people think about themselves.
Add Health participants (teens and young adults) were given a vocabulary test and were asked how often they lie to their parents about their whereabouts. I looked at the correlation between the two questions: it is a tiny .07 (sample size = 6,168). For males, it is a bit stronger--.10--while it is .only .05 for females. So, there is a tendency for smarter youths to lie more frequently, but it is very weak.
Anecdotally, I can see that my smartest child is the most dishonest. His lies are pretty clever for a 4 year old. A few more years, and he'll probably outsmart his old man. I'd like to think that I can teach him to be more honest, but behavioral genetic research makes me less optimistic.
By they way, Trivers seems to think that bright people not only deceive more; they are also more likely to self-deceive, which is contrary to what most intelligent people think about themselves.
Saturday, January 14, 2012
Agreeableness and marital status among men
According to the Game theory of male/female relations (correct me if I'm wrong), women tend to control whether a relationship is made or continued, and her decision depends on the guy's alpha-ness. She won't want to be in a relationship if the guy is too agreeable. If this is so, I would expect disagreeable men to be more likely than cooperative men to be married. The MIDUS study measured Big Five personality traits and asked about marital status. I dichotmized this variable into married (1) and not married (0). I looked at the relationship between the agreeableness scale and being married, and included age in the model as a control:
Logistic regression coefficients (sample = 1,788)
Age .01*
Agreeableness -.04
*statistically significant
Older men are more likely to be married, but being an agreeable guy doesn't hurt one's chance of marriage at all.
I suspect that the Game perspective is flawed by oversimplifying. As we learn from evolutionary psychology, women tend to look at men from two different perspectives: as short-term and long-term partners. They tend to be more attracted to the Alpha for short-term relationships but focus more on the Beta for marriage. Betas are at a disadvantage if they just want to get laid, but their cooperativeness does not appear to keep them out of long-term relationships. (Nor are they more likely to lose a wife through separation and divorce: the mean agreeableness scores for married, separated, and divorced men do not differ.)
Logistic regression coefficients (sample = 1,788)
Age .01*
Agreeableness -.04
*statistically significant
Older men are more likely to be married, but being an agreeable guy doesn't hurt one's chance of marriage at all.
I suspect that the Game perspective is flawed by oversimplifying. As we learn from evolutionary psychology, women tend to look at men from two different perspectives: as short-term and long-term partners. They tend to be more attracted to the Alpha for short-term relationships but focus more on the Beta for marriage. Betas are at a disadvantage if they just want to get laid, but their cooperativeness does not appear to keep them out of long-term relationships. (Nor are they more likely to lose a wife through separation and divorce: the mean agreeableness scores for married, separated, and divorced men do not differ.)
Race, gender, and self-deception
In his fascinating book The Folly of Fools, Robert Trivers theorizes that people are very prone to self-deception in order to better deceive others to one's advantage. You lie more effectively if you believe the lie yourself. Since having status is particularly important for men, they are more likely than women to inflate their abilities. To test this, I looked at Add Health data. I examined the relationship between gender and self-described intelligence, controlling for objective intelligence (based on a vocabulary test). I also added race/ethnicity to the model to see if groups differ in the tendency to exaggerate one's intelligence. All minority groups are compared to whites (who serve as the reference category):
Standardized OLS regression coefficients (sample size = 6,169)
Objective IQ .32*
Male (vs. female) -.02
Black .17*
Hispanic -.02
Asian .02
American Indian -.01
*statistically significant
First, people do have a tendency to rate their intelligence correctly--self-described intelligence is positively correlated with measured IQ--but the tendency is only moderate. Next, males are not more likely than females to inflate their smarts. By contrast, blacks are significantly more likely to--compared to whites. The other racial/ethnics groups do not differ from whites.
Regarding blacks, I'm not sure if this is a racial trait or something that is induced by living in a society with a high average IQ. Hispanics and American Indians have lower than average IQs, but do not inflate their intelligence more than whites, which makes me suspect that above-average boastfulness is a black thing.
One other item--the results do not support the claim that Asians underestimate their IQs (out of cultural modesty). The tendency for Hispanics to do so falls just short of statistical significance.
Standardized OLS regression coefficients (sample size = 6,169)
Objective IQ .32*
Male (vs. female) -.02
Black .17*
Hispanic -.02
Asian .02
American Indian -.01
*statistically significant
First, people do have a tendency to rate their intelligence correctly--self-described intelligence is positively correlated with measured IQ--but the tendency is only moderate. Next, males are not more likely than females to inflate their smarts. By contrast, blacks are significantly more likely to--compared to whites. The other racial/ethnics groups do not differ from whites.
Regarding blacks, I'm not sure if this is a racial trait or something that is induced by living in a society with a high average IQ. Hispanics and American Indians have lower than average IQs, but do not inflate their intelligence more than whites, which makes me suspect that above-average boastfulness is a black thing.
One other item--the results do not support the claim that Asians underestimate their IQs (out of cultural modesty). The tendency for Hispanics to do so falls just short of statistical significance.
Monday, January 09, 2012
Religiosity and single-parent kids
With religion's prohibition against abortion, I wondered if religious people might be more likely to have children and not be married. Using GSS data, I looked at white households with minor-age children. Here is the breakdown of marital status by church attendance (sample size = 611):
Never attends
Married 54.1
Widowed 5.2
Separated 6.2
Divorced 17.7
Never Married 16.8
Attends weekly
Married 76.5
Widowed 4.9
Separated 2.0
Divorced 9.5
Never Married 7.1
Religious people with kids at home are more likely to be married, and are less likely to be separated, divorced, or never-married. All comparisons are significantly different except for the widowed category.
Never attends
Married 54.1
Widowed 5.2
Separated 6.2
Divorced 17.7
Never Married 16.8
Attends weekly
Married 76.5
Widowed 4.9
Separated 2.0
Divorced 9.5
Never Married 7.1
Religious people with kids at home are more likely to be married, and are less likely to be separated, divorced, or never-married. All comparisons are significantly different except for the widowed category.
Racial differences in autism
Dr. Charlton asked about data concerning racial differences in autism. I merged the four National Health Interview Surveys from the past decade (sample size = 43,774) which yielded 193 autistic kids. The rate for whites is 4.5 per 1,000. It's 4.1 per 1,000 for blacks. I don't see much of a difference here.
Digit ratios and celebrity worship
A new study in Personality and Individual Differences looked at Korean teenagers and found that girls with more feminine digit ratios are much more likely to worship celebrities. The authors interpret this to mean that celebrity worship is a form of submissiveness seen in feminine girls ("feminine" meaning the girls were feminized by sex hormones prenatally):
The current study tested the hypothesis that digit ratios would be associated with celebrity worship, especially among adolescents. Our sample consisted of 45 male and 61 female participants aged 12–14 years (M = 13.20, SD = 0.71). We measured the digit ratios on the participants’ right hands and used the 23 items of the revised Celebrity Attitude Scale (CAS) to explore the degree to which participants engaged in celebrity worship. The average digit ratio was 0.95 (SD = 0.04) among male participants and 0.97 (SD = 0.05) among female participants. The mean CAS scores were 50.06 (SD = 20.63) for male participants and 64.49 (SD = 18.04) for female participants. The digit ratios for the entire sample were positively correlated with CAS scores (r = 0.29, p < 0.005). However, the digit ratios were positively correlated with CAS scores among female (r = 0.51, p < 0.001) but not male (r = −0.13, p = .394) participants. Our research found evidence of a significant positive correlation between 2D:4D ratios and celebrity worship in females but not in males, which indicated that females with lower digit ratios were less likely to worship celebrities.I thought it was a sexist society that makes girls but not boys go crazy for rock stars.
Saturday, January 07, 2012
Religious preference and nihilism
The MIDUS Study asked participants if they agree that they have a sense of direction and purpose in life. Answers ranged from "strongly agree" (1) to "strongly disagree (7). Here are the means by religious preference (sample size = 3,978):
Mean nihilism score
No religious preference 2.54
Agnostic 2.49
Buddhist 2.46
Episcopalian 2.24
Atheist 2.23
Lutheran 2.22*
Roman Catholic 2.20*
Methodist 2.19*
Presbyterian 2.17*
Jewish 2.09*
Pentecostal 1.93*
Mormon 1.91*
Born-again Christian 1.90*
Jehovah's Witness 1.71*
*significantly lower than those with no religious preference
Lower levels of nihilism are associated with having a religious affiliation and especially with belonging to a more conservative faith. For example, the gap between those with no religious preference and Jehovah's Witnesses is more than sixth-tenths of a standard deviation--a fairly large difference.
Mean nihilism score
No religious preference 2.54
Agnostic 2.49
Buddhist 2.46
Episcopalian 2.24
Atheist 2.23
Lutheran 2.22*
Roman Catholic 2.20*
Methodist 2.19*
Presbyterian 2.17*
Jewish 2.09*
Pentecostal 1.93*
Mormon 1.91*
Born-again Christian 1.90*
Jehovah's Witness 1.71*
*significantly lower than those with no religious preference
Lower levels of nihilism are associated with having a religious affiliation and especially with belonging to a more conservative faith. For example, the gap between those with no religious preference and Jehovah's Witnesses is more than sixth-tenths of a standard deviation--a fairly large difference.
Thursday, January 05, 2012
Atheism and nihilism
I categorized GSS participants as atheists or non-atheists, and as nihilists or non-nihilists. Nihilists answered strongly agree, agree, or neutral to the question that life serves no purpose. With a sample size of 3,708, I found that 17.8 percent of atheists versus 8.2 percent of everyone else are nihilists. This difference is statistically significant. So atheism more than doubles the risk of believing that life is without purpose. (On the other hand, the vast majority--more than 80 percent--of atheists believe life serves a purpose.)
Wednesday, January 04, 2012
Attitudes toward blacks by race/ethnicity
Drug Use Trajectory participants were asked: "Based on your experience, a person could be counted on to do what they say if that person was Black." Answers ranged from "strongly agree" (1) to "strongly disagree" (5). Here are the means by race/ethnicity (sample size = 1,795):
Mean "can't count on blacks" score
Whites 1.61
Hispanics 1.90*
Black Hispanics 2.28*
Blacks 2.88*
*significantly higher than whites
Blacks--both Hispanic and non-Hispanic--are much less likely to agree that blacks can be counted on. The gap in attitude between blacks and whites is huge--1.1 standard deviations. Whites have nicer views of blacks than Hispanics do, and they have a much more positive view of blacks than blacks have of themselves. So much for the idea that white attitudes make blacks feel bad about themselves.
Mean "can't count on blacks" score
Whites 1.61
Hispanics 1.90*
Black Hispanics 2.28*
Blacks 2.88*
*significantly higher than whites
Blacks--both Hispanic and non-Hispanic--are much less likely to agree that blacks can be counted on. The gap in attitude between blacks and whites is huge--1.1 standard deviations. Whites have nicer views of blacks than Hispanics do, and they have a much more positive view of blacks than blacks have of themselves. So much for the idea that white attitudes make blacks feel bad about themselves.
Monday, January 02, 2012
Religiosity and tax fraud
Here's a study that uses World Values Survey data and finds that greater religiosity is associated with less acceptance of tax fraud:
Religion provides an important basis for social integration and the prevention of deviant behavior, such as tax fraud, a crime that costs society billions of dollars in lost revenue. The literature on tax fraud and tax fraud acceptability (TFA) has neglected religiosity as a social bond that may deter this type of behavior. Furthermore, existing work is based on the United States; there are no systematic cross-national studies. In particular, there is no research exploring the "moral communities" hypothesis that religiosity's effect on deviance will vary according to the strength of national moral communities. The present study addresses these two gaps in the literature by analyzing data on 45,728 individuals in 36 nations from the World Values Surveys. We control for other predictors of TFA, including social bonds, economic strain, and demographic factors. The results determined that the higher the individual's level of religiosity, the lower the TFA. Results on the moral community's hypothesis were mixed. However, in a separate analysis of individual nations, the presence of a "moral community" (majority of the population identifies with a religious group) explained 39 percent of the variation in the presence or absence of the expected religiosity-TFA relationship. Furthermore, the presence of a communist regime in a nation, often known for the oppression of religious groups who then may view the regime as illegitimate, diminished the impact of religion on TFA.
Racial differences in antisocial personality disorder
A reader asked if I know of data on racial differences in psychopathy. I did find a sample of young adult South Floridians (called Drug Use Trajectories) which recorded DSM-IV diagnoses. Here are the percentages diagnosed with antisocial personality disorder (APD) by race/ethnicty (sample size = 1,792):
Percent with APD
Non-Hispanic white 12.3
Non-black Hispanic 13.2
Black Hispanic 30.8*
Black 19.0*
*significantly higher than non-Hispanic whites
Blacks--both Hispanic and non-Hispanic--have significantly higher numbers than whites or non-black Hispanics. Keep in mind that many of the Hispanics in this sample are Cuban. The pattern of findings suggests that race matters, not ethnicity or culture.
Percent with APD
Non-Hispanic white 12.3
Non-black Hispanic 13.2
Black Hispanic 30.8*
Black 19.0*
*significantly higher than non-Hispanic whites
Blacks--both Hispanic and non-Hispanic--have significantly higher numbers than whites or non-black Hispanics. Keep in mind that many of the Hispanics in this sample are Cuban. The pattern of findings suggests that race matters, not ethnicity or culture.
Thursday, December 29, 2011
Focus on money by political orientation
In his wonderful political novel The Possessed, Fyodor Dostoevsky wrote that socialists obsess about their own money more than anyone. Anecdotally, the flaming lesbian socialist professor whose office is next to mine is constantly on the phone with someone talking about her investments. (I can see why she worries. She has a lot more money than the rest of us. Her salary is 20 percent higher than any faculty I know.)
The General Social Survey asked respondents who is in charge of family finances (sample size = 208). This might not be the perfect measure of concern for money, but it's the best one I could find.
Twelve percent of liberals compared to 24 percent of conservatives said their spouse takes care of the money. (Gender is not a factor. Also--most couples share the responsibility.) So, by this measure, twice as many conservatives don't focus on money.
The General Social Survey asked respondents who is in charge of family finances (sample size = 208). This might not be the perfect measure of concern for money, but it's the best one I could find.
Twelve percent of liberals compared to 24 percent of conservatives said their spouse takes care of the money. (Gender is not a factor. Also--most couples share the responsibility.) So, by this measure, twice as many conservatives don't focus on money.
Wednesday, December 28, 2011
Coulter on the best illegal immigration candidate
Merry Christmas to me when mainstream pundits start sounding like us race realists. From Ann Coulter:
By the way, Ann goes on to conclude that Bachmann and Romney are the best on illegal immigration, but that only Romney can win.
In the upcoming presidential election, two issues are more important than any others: repealing Obamacare and halting illegal immigration. If we fail at either one, the country will be changed permanently.
Taxes can be raised and lowered. Regulations can be removed (though they rarely are). Attorneys general and Cabinet members can be fired. Laws can be repealed. Even Supreme Court justices eventually die.
But capitulate on illegal immigration, and the entire country will have the electorate of California. There will be no turning back.
By the way, Ann goes on to conclude that Bachmann and Romney are the best on illegal immigration, but that only Romney can win.
Tuesday, December 27, 2011
Racial differences in felony sentences
Using various sources (NCVS, UCR, BJS), I put together three tables which help explain why state prisoners are roughly half black even though African Americans are only 13 percent of the U.S. population. The disparity is divided into differences in commtting serious violent crimes (i.e., robbery, aggravated assault, and rape/sexual assault), differences in the chance of arrest, and differences in the probability of conviction. (One limitation is that government statisticians are idiots and lump Hispanics in with whites, so "whites in the following table actually means "whites plus Hispanics.")

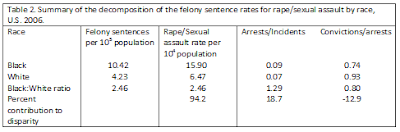


For all three types of violent crime, most of the racial disparity is due to blacks committing crimes at much higher rates. You might think this is obvious, but many liberals think the gap is due to a racist criminal justice system. Some of the difference in convictions is due to a greater black risk, given a crime, of being arrested. Some of this might be due to lower average black intelligence which leads to riskier crimes.
Finally, little or none of the racial gap is due to blacks being more likely to be convicted of a felony (which is likely to land one in prison for at least a year). In fact, given an arrest for rape, a white man is more likely to be convicted than a black man. This might be, in part, due to less willingness of African American jurors to put a fellow black behind bars for a crime that can be difficult to prove. Or perhaps victims of black offenders--often black themselves--tend to be less reliable.
Overall, if liberals are bothered by the racial disparity in prison (myself, I care about punishing bad guys), the data suggests that they should focus on black criminality, not the system.
Monday, December 26, 2011
Study: Sex differences in brain volume are related to specific skills, not to general intelligence
A new study in the journal Intelligence of 100 Spaniard male and female college students reports that men, on average, have more total brain volume (TBV) and more gray matter volume (GMV), but these do not translate into higher general intelligence (g). Sex differences only appear for specific mental abilities. TBV and GMV are positively correlated with greater visuospatial skills (i.e., mental rotation). By contrast, higher specific verbal skills are associated with lower: 1) visuospatial skills, 2) total brain volume, and 3) white matter volume. From these results, the researchers conclude that larger male brains provide more total neurons needed for mental manipulation of 3D objects, while smaller female brains might work more efficiently to give enhanced verbal skills (that are unrelated to g).
Friday, December 23, 2011
Charlton's Thought Prison
Do yourself a favor and read Thought Prison: The Fundamental Nature of Political Correctness--a new book written by the distinguished scholar (and reader of this blog) Dr. Bruce Charlton. I've read 500-page books before (e.g., Interpretation of Dreams) that taught me very little, but Dr. Charlton's 2-hour book might change your worldview. If asked, many people might say that the most serious problem facing the West today is economic, but Thought Prison makes the compelling case that the ideology of political correctness will eventually destroy us. According to Charlton, there is a small chance that we can beat it with a populist Right movement, but the more realistic response is personal defiance. What does he mean by this? I'm not going to give the whole thing away. Read the book and find out. Then comment here if you feel like it.
Thursday, December 22, 2011
Homosexual voting over the past three decades
Have homosexuals moved left over time? According to the GSS, it looks like they have. Shown below are the percent (of all gay men, bisexuals, and lesbians) who voted for the Democrat in the presidential election:
Percent who voted for the Democrat
Obama 88
Kerry 73
Gore 66
Clinton 75
Clinton 62
Dukakis 63
Mondale 57
The Democrat share rose from 57 percent in 1984 to 88 percent in 2008. It looks like the culture war may have pushed non-heteros to the left (although they started this period somewhat to the left anyway) .
Percent who voted for the Democrat
Obama 88
Kerry 73
Gore 66
Clinton 75
Clinton 62
Dukakis 63
Mondale 57
The Democrat share rose from 57 percent in 1984 to 88 percent in 2008. It looks like the culture war may have pushed non-heteros to the left (although they started this period somewhat to the left anyway) .
Sunday, December 18, 2011
Characteristics of smart people who don't go to college
In the comments section of the last post, reader SFG wonders about the characteristics of people who are smart but who do not go to college.
Using GSS data, I created a two-category variable where people with eight through ten out of ten questions correct on a vocabulary quiz but who never went to college are assigned a one, and everyone else is given a zero. Those in the first category make up about 11 percent of the total adult population surveyed over the past 40 years.
Next, I chose eight variables as predictors. Here are the logistic regression coefficients (sample size = 16,215):
Logistic Regression Coefficients
Year -.02
Age .02
Sex .42
Race 1.45
Father's education .03
Church attendance -.04
Political conservatism .01
Number of offspring -.03
All of the predictors are significantly related to the outcome variable except for political conservatism. So what is the profile of someone who is smart but went no further than high school? I'll attempt to list factors from most powerful to least: older, white, being surveyed in earlier years, female, having an educated father, going to church less often, and having fewer children.
I also compared the mean incomes of the two categories. The smart group that didn't go to college made about $1,000 more a year than the average for the other group.
Many of the factors make sense. Older people from earlier cohorts were less likely to go to college, even if they were intelligent. The same for women. Blacks are much less likely to be bright people who fail to attend college. Having a successful father can sometimes open a good career path that requires no higher education. Perhaps irreligiosity indicates unconventionality. Political attitudes appear to have no effect on choosing to avoid college.
Using GSS data, I created a two-category variable where people with eight through ten out of ten questions correct on a vocabulary quiz but who never went to college are assigned a one, and everyone else is given a zero. Those in the first category make up about 11 percent of the total adult population surveyed over the past 40 years.
Next, I chose eight variables as predictors. Here are the logistic regression coefficients (sample size = 16,215):
Logistic Regression Coefficients
Year -.02
Age .02
Sex .42
Race 1.45
Father's education .03
Church attendance -.04
Political conservatism .01
Number of offspring -.03
All of the predictors are significantly related to the outcome variable except for political conservatism. So what is the profile of someone who is smart but went no further than high school? I'll attempt to list factors from most powerful to least: older, white, being surveyed in earlier years, female, having an educated father, going to church less often, and having fewer children.
I also compared the mean incomes of the two categories. The smart group that didn't go to college made about $1,000 more a year than the average for the other group.
Many of the factors make sense. Older people from earlier cohorts were less likely to go to college, even if they were intelligent. The same for women. Blacks are much less likely to be bright people who fail to attend college. Having a successful father can sometimes open a good career path that requires no higher education. Perhaps irreligiosity indicates unconventionality. Political attitudes appear to have no effect on choosing to avoid college.
Tuesday, December 13, 2011
IQ and spanking
GSS respondents were asked: "Do you strongly agree, agree, disagree, or strongly disagree that it is sometimes necessary to discipline a child with a good, hard spanking?" I assigned the following scores to answers: strongly agree (4), agree (3), disagree (2), and strongly disagree (1):
Mean spanking scores (sample size = 13,506)
Smart group 2.71
Mediocre group 2.98*
Dull group 3.05*
*significantly higher than smart group
There is a four-tenths of a standard deviation between the smart and dull group--a medium-size gap. It is not clear to me that the view that spanking is never necessary is the rational one. Smart people do seem to be leading the charge against strict discipline.
Mean spanking scores (sample size = 13,506)
Smart group 2.71
Mediocre group 2.98*
Dull group 3.05*
*significantly higher than smart group
There is a four-tenths of a standard deviation between the smart and dull group--a medium-size gap. It is not clear to me that the view that spanking is never necessary is the rational one. Smart people do seem to be leading the charge against strict discipline.
Monday, December 12, 2011
Scientists, artists, and empathy
In The Science of Evil, Simon Baron-Cohen reports research that found that artists are more empathetic than scientists and engineers. I replicated this with GSS data. Respondents were asked how well does the following statement describe them: "Sometimes I don't feel very sorry for other people when they are having problems." Answers ranged from "does not describe very well" (1) to "describes very well" (5). I reverse-scored the answers so that high numbers reflect high empathy. Here are the means (sample size = 124):
Mean empathy score
Scientists/Engineers 3.34
Writers/Actors/Painters/Dancers/Musicians 3.77
This is four-tenths of a standard deviation difference--a medium-size gap--but it is not statistically significant.
Mean empathy score
Scientists/Engineers 3.34
Writers/Actors/Painters/Dancers/Musicians 3.77
This is four-tenths of a standard deviation difference--a medium-size gap--but it is not statistically significant.
Friday, December 09, 2011
Skin color and occupational prestige among blacks
As a follow-up to the last post, I looked to see if skin color among blacks is related to occupational prestige. Interviewers rated skin color from very dark brown to very light brown. Here are the mean prestige scores (GSS data, sample size = 454):
Mean occupational prestige scores
Very dark brown 28.3
Dark brown 28.4
Medium brown 35.3*
Light brown 33.2
Very light brown 42.7*
*significantly higher than the very dark brown group
Lighter groups tend to have better jobs than darker groups. This is consistent with the common observation that elite blacks often look like they have more European ancestry.
Mean occupational prestige scores
Very dark brown 28.3
Dark brown 28.4
Medium brown 35.3*
Light brown 33.2
Very light brown 42.7*
*significantly higher than the very dark brown group
Lighter groups tend to have better jobs than darker groups. This is consistent with the common observation that elite blacks often look like they have more European ancestry.
Tuesday, December 06, 2011
Skin color and desirable traits
Donald Templer and J. Phillippe Rushton have recently published a study of the 50 U.S. states which finds strong correlations among the following varaibles: skin color, IQ, infant mortality, life expectancy, violent crime, HIV/AIDS, and income. This pattern mirrors what Templer has observed internatioanlly. Skin color tends to be more strongly correlated to the list of variables than does income, so the authors conclude that this points to biology rather than economic environment as the more important explanation of the pattern of correlations. They rely on Rushton's life history theory and Lynn's cold climate theory to make sense of why the variables hang together, but whatever the explanation, there seems to be a worldwide pattern of desirable (or undesirable traits) running together, and this is closely associated with skin color.
They review some interesting research by Ducrest et al. (2008) which found that in 20 wild vertebrate species, darker individuals are more aggressive, sexually active, and resistant to stress. They also tend to have a larger body mass and greater energy and physical activity. For example, darker maned male lions are reported to be more aggressive and sexually more active, and darker barn owls show stronger immune response. Darker coloration is associated with enhanced fertility, female sexual receptivity, male sexual motivation and performance, and higher levels of testosterone. Ducrest et al., however, cautioned that these findings might not apply to humans.
They review some interesting research by Ducrest et al. (2008) which found that in 20 wild vertebrate species, darker individuals are more aggressive, sexually active, and resistant to stress. They also tend to have a larger body mass and greater energy and physical activity. For example, darker maned male lions are reported to be more aggressive and sexually more active, and darker barn owls show stronger immune response. Darker coloration is associated with enhanced fertility, female sexual receptivity, male sexual motivation and performance, and higher levels of testosterone. Ducrest et al., however, cautioned that these findings might not apply to humans.
Friday, December 02, 2011
I love American elites
Zbigniew Brzezinski said on Morning Joe this morning that the U.S. is the most socially unjust country in the world because our GINI coefficient is the highest in the world. He's close: We are 40th.
I love American elites. They import tens of millions of poor immigrants over the years and then point and say, "The U.S. is evil because it's so unequal!"
I love American elites. They import tens of millions of poor immigrants over the years and then point and say, "The U.S. is evil because it's so unequal!"
Rootedness of illegal aliens

Newt Gingrich says we shouldn't deport illegals who have roots here. The Pew pie chart shows that only 15 percent of illegal aliens have been here less than 5 years. According to the lower graph, 46 percent have minor children here in the country. By Newt's standard, few of the ten million (Pew's estimate) should be sent home. (I love the term "unauthorized immigrant." That's like calling a burglar an "unapproved entrant.")

Monday, November 28, 2011
Predictors of wanting porn to be illegal
GSS participants were asked if they thought that porn should be illegal. I looked to see which characteristics predict answering yes (sample size = 12,246):
Logistic Regression Coefficients
Age .03
Sex .81
Educ -.04
IQ -.01
Income -.01
Church attendance .19
Conservatism .21
Year -.01
All the relationships are statistically significant at the 95 percent confidence level (two-tailed test). Making porn illegal is favored by people who are: older, female, less educated, less intelligent, poorer, more religious, and more conservative. In addition, support for getting rid of the stuff has dropped over the past 40 years.
The coefficients are not standardized, so don't try to estimate the strength of a relationship from the numbers. Actually, it looks like the most powerful predictors are: age, religiosity, sex, and conservatism, in that order. I was surprised to see that almost half of women support banning pornography, and this number has changed little in 40 years.
Dana Carvey was on to something with his SNL "Church Lady." Funny stuff, but call me crazy: I respect old religious women.
Logistic Regression Coefficients
Age .03
Sex .81
Educ -.04
IQ -.01
Income -.01
Church attendance .19
Conservatism .21
Year -.01
All the relationships are statistically significant at the 95 percent confidence level (two-tailed test). Making porn illegal is favored by people who are: older, female, less educated, less intelligent, poorer, more religious, and more conservative. In addition, support for getting rid of the stuff has dropped over the past 40 years.
The coefficients are not standardized, so don't try to estimate the strength of a relationship from the numbers. Actually, it looks like the most powerful predictors are: age, religiosity, sex, and conservatism, in that order. I was surprised to see that almost half of women support banning pornography, and this number has changed little in 40 years.
Dana Carvey was on to something with his SNL "Church Lady." Funny stuff, but call me crazy: I respect old religious women.
Saturday, November 26, 2011
Height and family size
A study reported by the BBC (H/T Jason Malloy) found that, contrary to expectations, tall men do not have the most children. Men of average height do.
I replicated the study with MIDUS data on 2,316 white men, and found the following:
Mean number of children
Tall men 2.43
Average men 2.57
Short men 2.46
The results are similar to the study's (the numbers are high because stepchildren and adopted children are included). The difference is attributed to average men marrying earlier. The thinking seems to be that taller men hold out longer before getting married--because of greater attractiveness--and end up marrying women who are also older and who have fewer married years in which to have children.
I replicated the study with MIDUS data on 2,316 white men, and found the following:
Mean number of children
Tall men 2.43
Average men 2.57
Short men 2.46
The results are similar to the study's (the numbers are high because stepchildren and adopted children are included). The difference is attributed to average men marrying earlier. The thinking seems to be that taller men hold out longer before getting married--because of greater attractiveness--and end up marrying women who are also older and who have fewer married years in which to have children.
Friday, November 25, 2011
Which major has the smartest students?
Using GSS data, I calculated the mean IQ for people who graduated with degrees in popular majors (sample = 855)
Mean IQ
English 112.0
History 111.3
Law 110.1
Art 110.0
Political Science 107.9
Biology 107.1
General Sciences 106.6
Education 106.1
Communications 105.9
Math 105.6
Finance 105.4
Psychology 105.2
Marketing 105.0
Overall average 104.3
Liberal Arts 104.0
Engineering 103.8
Law Enforcement 103.8
Social Work 103.6
Business Administration 102.4
Computer Science 102.2
Health 101.9
Accounting 101.7
Nursing 101.3
General Studies 101.1
Keep in mind that IQ is measured with a vocabulary test which favors verbal intelligence. Notice how the smartest students tend to major in the least practical fields.
I divided majors into practical and not practical, and found a difference:
Mean IQ
Not practical 106.5
Practical 103.4
Smart people tend to choose majors which are least likely to translate into a job. This is another indication of how smart people are not necessarily the most rational.
Mean IQ
English 112.0
History 111.3
Law 110.1
Art 110.0
Political Science 107.9
Biology 107.1
General Sciences 106.6
Education 106.1
Communications 105.9
Math 105.6
Finance 105.4
Psychology 105.2
Marketing 105.0
Overall average 104.3
Liberal Arts 104.0
Engineering 103.8
Law Enforcement 103.8
Social Work 103.6
Business Administration 102.4
Computer Science 102.2
Health 101.9
Accounting 101.7
Nursing 101.3
General Studies 101.1
Keep in mind that IQ is measured with a vocabulary test which favors verbal intelligence. Notice how the smartest students tend to major in the least practical fields.
I divided majors into practical and not practical, and found a difference:
Mean IQ
Not practical 106.5
Practical 103.4
Smart people tend to choose majors which are least likely to translate into a job. This is another indication of how smart people are not necessarily the most rational.
Monday, November 21, 2011
Regional traditionalism and marriage among black men
Blacks seem to do a little better in more conservative regions.
Using GSS data for the nine U.S. regions, I calculated the Pearson correlations between: 1) the percent of black men who are married, 2) the mean level of church attendance (for all races), and 3) the mean level of political conservatism (for all races).
All correlations are positive and very strong: percent married/church attendance, .84; and percent married/political conservatism, .66. (While we're at it, the correlation between attendance and conservatism across the nine regions is .89. Religiosity and conservatism are, empirically, practically the same thing.)
Using GSS data for the nine U.S. regions, I calculated the Pearson correlations between: 1) the percent of black men who are married, 2) the mean level of church attendance (for all races), and 3) the mean level of political conservatism (for all races).
All correlations are positive and very strong: percent married/church attendance, .84; and percent married/political conservatism, .66. (While we're at it, the correlation between attendance and conservatism across the nine regions is .89. Religiosity and conservatism are, empirically, practically the same thing.)
Thursday, November 17, 2011
Hispanics are now the face of American poverty

This graph from Pew shows that if the poverty rate is adjusted for such items as medical expenses, tax credits, and non-cash government benefits, Hispanics become the poorest large group of Americans. Over the past 45 years, we have imported a population which is now bigger and poorer than the black community. Our worst enemies could never have done this to us.
Sunday, November 13, 2011
On the measurement of energy
Steve Sailer says, "It's unfortunate that social scientists don't seem to have a reliable quick test of energy the way they have tests of intelligence, since it's obvious that energy differs widely among individuals and is important in influencing life outcomes."
The GSS has asked participants the following: "How much of the time during the past 4 weeks did you have a lot of energy?" Turns out, the answers are roughly normally distributed (sample size = 1,409):
Percent having a lot of energy over the past month
All the time 10.4
Most of the time 34.5
A good bit of time 22.6
Some of the time 18.4
A little biit of the time 9.5
None of the time 4.6
And here are the correlations with several variables:
Age -.18
Education .12
Income .15
Occupational prestige .05
As expected, energy decreases with age, and is associated with more education and income. (The correlation with occupational prestige is trivial).
These findings provide evidence that this single item is not an invalid measure of energy. The correlations are small, but I would expect just that, given that we are measuring a trait at one moment in time that has exerted its influence over a lifetime. Add to that the fact that energy level is probably not as stable over time as, say, IQ.
Like Steve, I see energy making a big difference. I would be a much more accomplished person if I had the energy. Reading my blog, you might think I have a preference for brevity. Truth is, I'm too lazy to write more. I'd like to do the research to find out how to boost my drive, but it makes me tired even to contemplate it. I'll lie down and let the impulse pass.
-
The GSS has asked participants the following: "How much of the time during the past 4 weeks did you have a lot of energy?" Turns out, the answers are roughly normally distributed (sample size = 1,409):
Percent having a lot of energy over the past month
All the time 10.4
Most of the time 34.5
A good bit of time 22.6
Some of the time 18.4
A little biit of the time 9.5
None of the time 4.6
And here are the correlations with several variables:
Age -.18
Education .12
Income .15
Occupational prestige .05
As expected, energy decreases with age, and is associated with more education and income. (The correlation with occupational prestige is trivial).
These findings provide evidence that this single item is not an invalid measure of energy. The correlations are small, but I would expect just that, given that we are measuring a trait at one moment in time that has exerted its influence over a lifetime. Add to that the fact that energy level is probably not as stable over time as, say, IQ.
Like Steve, I see energy making a big difference. I would be a much more accomplished person if I had the energy. Reading my blog, you might think I have a preference for brevity. Truth is, I'm too lazy to write more. I'd like to do the research to find out how to boost my drive, but it makes me tired even to contemplate it. I'll lie down and let the impulse pass.
-
Friday, November 11, 2011
Thursday, November 10, 2011
Wednesday, November 09, 2011
Growing up Mormon and marital infidelity
Here are the percentages of Americans who have cheated on their spouse listed by whether or not you grew up as a Mormon (sample size = 1,104):
Percent ever cheating on spouse
Grew up Mormon 4.5
Everyone else 17.6
The difference is not statistically significant because there are only 44 people in the sample who grew up Mormon.
Percent ever cheating on spouse
Grew up Mormon 4.5
Everyone else 17.6
The difference is not statistically significant because there are only 44 people in the sample who grew up Mormon.
Monday, November 07, 2011
Race and sexual harassment
The Cain sexual harassment scandal makes me wish I had good survey data in order to look, for example, at whether there are racial differences. The Longitudinal Study of Violence Against Women did ask male college students if they have ever used their authority (as boss, teacher, camp counselor, supervisor, etc.) to get a female to engage in unwanted: 1) sexual activities short of intercourse, and 2) intercourse. Here are the percentages of men who answered yes (sample size = 821):
Percent using authority for sex play
Whites 2.3
Blacks 1.4
Others 4.2
Percent using authority for intercourse
Whites 3.0
Blacks 2.8
Others 6.2
None of the differences are significantly different due to the rarity of sexual harassment. Keep in mind that blacks and others (who are mostly Hispanic) are less likely to have positions of authority so their rates would probably be higher if they equaled whites in leadership positions. Plus, validity research has shown that black males are less willing than whites to admit to deviant behavior.
Percent using authority for sex play
Whites 2.3
Blacks 1.4
Others 4.2
Percent using authority for intercourse
Whites 3.0
Blacks 2.8
Others 6.2
None of the differences are significantly different due to the rarity of sexual harassment. Keep in mind that blacks and others (who are mostly Hispanic) are less likely to have positions of authority so their rates would probably be higher if they equaled whites in leadership positions. Plus, validity research has shown that black males are less willing than whites to admit to deviant behavior.
Study: Flynn effect is not caused by hybrid vigor
From Psychological Review:
Mingroni (see record2007-10421-011 ) proposed that heterosis or hybrid vigor may be the principal driver of the Flynn effect—the tendency for IQ scores to increase at a rate of approximately 3 points per decade. This model was presented as a resolution to the IQ paradox—the observation that IQ scores have been increasing despite their high adult heritability—on the basis that substantial changes in IQ can only be accounted for by changes in underlying genetic factors. It is here argued that this model is predicated upon a misconception of the Flynn effect, which is most pronounced on the least g-loaded components of cognitive ability tests and is uncorrelated with genetic effects such as inbreeding depression scores (which are correlated with the g loadings of tests). Evidence supportive of the recently proposed life history model of the Flynn effect is presented. In the discussion, other theoretical objections to the heterosis model are also considered. On this basis, it is concluded that the Flynn effect is strongly entwined with developmental status and that heterosis cannot be its principal cause.
Sunday, November 06, 2011
Social class, camping, and fundamentalism
Do lower status whites enjoy nature? GSS respondents were asked if they've gone camping in the past year. Based on occupational prestige scores, I constructed 4 classes: lower, working, middle, and upper.
Percent who camp
Lower 41.6 (n = 269)
Working 46.5 (n = 376)
Middle 46.6 (n = 397)
Upper 53.3 (n = 260)
The share goes up a little among higher classes, but the differences are not statistically significant. Enjoying nature is common at all social levels.
While we're focusing on class, let's look at the belief among whites that the Bible is inerrant. In an earlier post, I looked at differences by education, but occupational prestige is a more direct measure of social class. I'm highly educated but far from upper class.
Percent who believe Bible is inerrant
Lower 37.8 (n = 1,345)
Working 34.0 (n = 1,725)
Middle 25.1 (n = 1,318)
Upper 17.9 (n = 751)
The lower and working classes are not significantly different, but all other comparisons are. The claim that Biblical fundamentalism is an middle- or upper-class movement is simply incorrect.
Percent who camp
Lower 41.6 (n = 269)
Working 46.5 (n = 376)
Middle 46.6 (n = 397)
Upper 53.3 (n = 260)
The share goes up a little among higher classes, but the differences are not statistically significant. Enjoying nature is common at all social levels.
While we're focusing on class, let's look at the belief among whites that the Bible is inerrant. In an earlier post, I looked at differences by education, but occupational prestige is a more direct measure of social class. I'm highly educated but far from upper class.
Percent who believe Bible is inerrant
Lower 37.8 (n = 1,345)
Working 34.0 (n = 1,725)
Middle 25.1 (n = 1,318)
Upper 17.9 (n = 751)
The lower and working classes are not significantly different, but all other comparisons are. The claim that Biblical fundamentalism is an middle- or upper-class movement is simply incorrect.
Wednesday, November 02, 2011
Ethnicity and camping
Half Sigma has observed that black folks don't enjoy nature. The General Social Survey asked Americans if they've gone camping in the past 12 months. Here are the percentages who answered yes by ethnic group:
Percent who camped in past year
Norwegian 66.7*
Dutch 52.9
Irish 52.4
Mexican 50.0
German 50.4
English/Welsh 46.7
Polish 46.2
Scottish 46.0
Italian 45.8
Russian 44.0
Jewish 40.6
Swedish 37.5
American Indian 13.3**
Blacks 10.7**
*significantly above average
**significantly below average
Blacks are at the bottom of the list. American Indians are next which is pretty ironic. Perhaps sleeping in a teepee isn't camping, it's home.
Half Sigma also claims that working-class whites love nature. I think he's right. (My blue-collar parents practically live in the wild.) We'll look at the data next.
Percent who camped in past year
Norwegian 66.7*
Dutch 52.9
Irish 52.4
Mexican 50.0
German 50.4
English/Welsh 46.7
Polish 46.2
Scottish 46.0
Italian 45.8
Russian 44.0
Jewish 40.6
Swedish 37.5
American Indian 13.3**
Blacks 10.7**
*significantly above average
**significantly below average
Blacks are at the bottom of the list. American Indians are next which is pretty ironic. Perhaps sleeping in a teepee isn't camping, it's home.
Half Sigma also claims that working-class whites love nature. I think he's right. (My blue-collar parents practically live in the wild.) We'll look at the data next.
How much evidence of racism?
Herman Cain was asked if racism is behind the story that he may have sexually harassed some employees. He answered yes. His next statement succintly summarized the grounds for the daily cries of racism we hear in contemporary America. When asked if he had any evidence to support his claim, he said no, none.
Monday, October 31, 2011
Ethnicity and nihilism
I calculated mean nihilism scores by ethnic group. (The question is about agreement that life serves no purpose, sample size = 3,051):
Mean nihilism score
Mexicans 1.93*
Filipino 1.80
Polish 1.78*
Puerto Rican 1.74
Czech 1.73
French Canadians 1.69
American Indian 1.68
Blacks 1.59
Swiss 1.58
Danish 1.57
Hungarian 1.55
Average 1.55
French 1.51
Italians 1.51
Asian Indian 1.50
Spanish 1.50
Germans 1.50
Chinese 1.50
Scottish 1.48
Jewish 1.48
Dutch 1.47
English/Welsh 1.47
Irish 1.48
Yugoslavs 1.40
Norwegian 1.40
Swedish 1.36**
Russian 1.35
Greek 1.33**
* significantly above average
** significantly below average
Data analyses on this blog have revealed again and again that Mexican Americans are in many ways a distinctive group. The gap between them and Greek Americans is large--three-quarters of a standard deviation. One reason why farm workers are nihilistic (as we saw in the previous post) is because they are disproportionately Mexican.
Mean nihilism score
Mexicans 1.93*
Filipino 1.80
Polish 1.78*
Puerto Rican 1.74
Czech 1.73
French Canadians 1.69
American Indian 1.68
Blacks 1.59
Swiss 1.58
Danish 1.57
Hungarian 1.55
Average 1.55
French 1.51
Italians 1.51
Asian Indian 1.50
Spanish 1.50
Germans 1.50
Chinese 1.50
Scottish 1.48
Jewish 1.48
Dutch 1.47
English/Welsh 1.47
Irish 1.48
Yugoslavs 1.40
Norwegian 1.40
Swedish 1.36**
Russian 1.35
Greek 1.33**
* significantly above average
** significantly below average
Data analyses on this blog have revealed again and again that Mexican Americans are in many ways a distinctive group. The gap between them and Greek Americans is large--three-quarters of a standard deviation. One reason why farm workers are nihilistic (as we saw in the previous post) is because they are disproportionately Mexican.
Sunday, October 30, 2011
Finding purpose
For those looking for direction in life, I think I've found a method. Ask yourself what you are willing to die for, and live for that. When I pose the question to myself, the answer that immediately comes to mind is my children.
Friday, October 28, 2011
Occupation and nihilism
General Social Survey (GSS) participants were asked if they agree that life serves no purpose. Answers range from strongly disagree (1) to strongly agree (5). I calculated the mean by occupation and list below the top and bottom five:
Nihilism--Top Five Means
Farm workers 2.20
Health aide 1.91
Construction laborers 1.89
Sewing machine operator 1.88
Farmers 1.86
Machine operator 1.86
Nihilism--Bottom Five Means
Sales supevisor 1.30
Other finanical officers 1.25
Financial managers 1.20
Managers 1.19
Real estates sales 1.17
The difference between farm workers and real estate sales is large--1.3 standard deviations. Evidently, a sense of meaningless is more of a problem for people with low status, repetitive occupations. Jobs with power and money are correlated with less nihilism. Perhaps powerlessness is a major source of thinking that life serves no purpose.
Nihilism--Top Five Means
Farm workers 2.20
Health aide 1.91
Construction laborers 1.89
Sewing machine operator 1.88
Farmers 1.86
Machine operator 1.86
Nihilism--Bottom Five Means
Sales supevisor 1.30
Other finanical officers 1.25
Financial managers 1.20
Managers 1.19
Real estates sales 1.17
The difference between farm workers and real estate sales is large--1.3 standard deviations. Evidently, a sense of meaningless is more of a problem for people with low status, repetitive occupations. Jobs with power and money are correlated with less nihilism. Perhaps powerlessness is a major source of thinking that life serves no purpose.
Wednesday, October 26, 2011
Social class and fundamentalism
A reader commented in the "Fundamentalists and delinquency" post that belief in the inerrancy of the Bible is an upper-class phenomenon.
GSS participants were asked: "Which of these statements comes closest to describing your feelings about the Bible? 1. The Bible is the actual word of God and is to be taken literally, word for word. 2. The Bible is the inspired word of God but not everything in it should be taken literally, word for word. 3. The Bible is an ancient book of fables, legends, history, and moral precepts recorded by men."
Here are mean levels of education by answer for whites (sample size = 19,324):
Word of God 12.01
Inspired word 13.71
Book of fables 14.33
Other 14.13
At the 95 percent confidence level, the Inspired Word group is significantly more educated than the Word of God group, and the Book of Fables group is more educated than both of them.
GSS participants were asked: "Which of these statements comes closest to describing your feelings about the Bible? 1. The Bible is the actual word of God and is to be taken literally, word for word. 2. The Bible is the inspired word of God but not everything in it should be taken literally, word for word. 3. The Bible is an ancient book of fables, legends, history, and moral precepts recorded by men."
Here are mean levels of education by answer for whites (sample size = 19,324):
Word of God 12.01
Inspired word 13.71
Book of fables 14.33
Other 14.13
At the 95 percent confidence level, the Inspired Word group is significantly more educated than the Word of God group, and the Book of Fables group is more educated than both of them.
Saturday, October 22, 2011
Racial differences in child abuse deaths
BBC News is making a big deal about the high rate of child abuse deaths in America. Michael Petit, president of Every Child Matters, gives a long list of liberal explanations for the problem. For all his expertise, he somehow forgot to mention race. According to CDC data, the deaths of 0-4 years olds per 100,000 by race for the 1999-2007 period are as follows: Asians 1.6, non-Hispanic whites 2.5, Hispanics 3.2, American Indians 6.6, and blacks 8.3.
Petit, I'm sure, is privately aware of the racial differences, but he might not know about regional differences among non-Hispanic whites:
New England 1.3
Mid-Atlantic 1.7
Pacific 2.0
S. Atlantic 2.5
West North Central 2.6
East North Central 2.8
East South Central 3.0
Mountain 3.1
West South Central 3.1
Coastal whites are less violent.
Petit, I'm sure, is privately aware of the racial differences, but he might not know about regional differences among non-Hispanic whites:
New England 1.3
Mid-Atlantic 1.7
Pacific 2.0
S. Atlantic 2.5
West North Central 2.6
East North Central 2.8
East South Central 3.0
Mountain 3.1
West South Central 3.1
Coastal whites are less violent.
Wednesday, October 19, 2011
Fundamentalists and delinquency

*significantly more than fundamentalists
White Add Health respondents (sample size = 3,489) were asked, "Do you agree or disagree that the sacred scriptures of your religion are the word of God and are completely without any mistakes?" The above table shows the percentages who have committed a specific crime at least once in the past 12 months. "Fund" is short for fundamentalist.
You can see a tendency of fundamentalist teenagers to be more law-abiding than youths who don't believe scripture is inerrant. Keep in mind that fundamentalists have the disadvantages of lower average IQs and socioeconomic status. They are not less violent, just less prone to commit property crime. Perhaps conservative religious people are the same as others on attitudes toward violence, but are more respectful of property.
Monday, October 17, 2011
Trends in Catholic religiosity

In his new book Suicide of a Superpower, Pat Buchanan claims that since Vatican II, American Catholics have gotten less religious and more culturally liberal. The graph (GSS data, sample size = 13,432) shows that he's right. Attending more than weekly (gray) or weekly (pink) is down. The following are up: 2-3 times a month (magenta), once a month (gold), once a year (green), and never (red).

This graph shows that Catholics are slightly more approving of abortion for any reason than they were in the 1970s.
Trends for Mexican Americans (data not shown) are more conservative. Attendance has basically held steady over the past four decades, and support for abortion on demand has actually dropped from 38 to 23 percent. My guess is that the constant infusion of new immigrants from Mexico keeps Catholic Mex-Ams religious and comparatively conservative on abortion.
Sunday, October 16, 2011
Thursday, October 13, 2011
I see that Warren Buffett paid $7 million last year in federal income taxes. He and I are two American citizens who have a duty to contribute to our country. I'm a middle-income college professor. The federal government paid me $2,000 last year (I paid in 2k and got a return of 4k). How am I getting screwed, exactly?
Trends in support for the death penalty

This graph from Gallup reveals a pragmatic streak among Americans on the issue of the death penalty. During periods of low or declining violence (the 30s, 40s, 50s and the past 15 years) more people get compassionate and idealistic. But Americans abandon their idealism when things get dangerous. The 1965-1995 crime wave was accompanied by growing support for executions. My own take is that this pragmatism is an American strength.
Tuesday, October 11, 2011
Mormons and delinquency

These numbers, based on Add Health data, show that Mormons tend to be less delinquent than teens with no religion. Most differences are not statistically significant because the sample includes only 79 Mormons.
Monday, October 10, 2011
Illegal immigration and military spending
According to the GSS (sample = 681), among those who consider immigration to be the single most important national issue, 42.4 percent feel that we don't spend enough on defense. Compare that to only 27.8 percent of all respondents. I suspect that people who are especially concerned about national security tend to be both hawkish and strongly against illegal immigration.
Sunday, October 09, 2011
Evangelicals and cheating
Are married born-agains less likely to cheat than others? Looking at GSS data (sample size = 6,423), the answer is no. Among whites, the percent unfaithful is 16.5 for evangelicals and 17.7 for everyone else. For blacks, it is 24.7 and 26.6 percent. The differences are not statistically significant. I checked to see if controlling for education would change the results. It doesn't.
Subscribe to:
Posts (Atom)
Are gun owners mentally ill?
Some anti-gun people think owning a gun is a sign of some kind of mental abnormality. According to General Social Survey data, gun owners ...

-
Via a reader at iSteve, it looks like this might be the vocabulary test used by the General Social Survey. (Someone please tell me if I'...
-
 In the comments in the last post , some readers contended that Jews are not ethnocentric. Using the same question I used in the comments se...
-
Here's the second set I promised. A reader suggested that the first set tends to be older, and it is among younger blacks where you see ...
