The National Couples Survey asked 593 people if they've slept with someone else since being married. Here are the percentages answering yes by race/ethnicity:
Percent
Whites 6.2
Blacks 17.8*
Hispanics 9.1
Asians 15.4
Amerindians 10.0
* p < .05, two-tail test, compared with whites.
Samples sizes for minority groups are small--only blacks have significantly higher rates. (I know that someone having multiple partners in an open marriage would be included with the cheaters, but this type of arrangement is rare, I think.)
Sunday, January 31, 2010
Saturday, January 30, 2010
Political party and favoring more Haitian immigration

This Gallup graph shows a 30 point split (57% versus 27%) between Democrats and Republicans on favoring more Haitian immigrants.
Hispanic gang membership
In his American Conservative article "His-Panic" (the same title used in Geraldo Rivera's recent book), Ron Unz suggests that criminal justice officials have invented the Hispanic gang problem in order to secure federal anti-gang dollars.
As was shown in the last post, the best approach to such questions is to seek out the best data. I found two studies in which researchers surveyed adolescents about membership in a gang. Descriptions of each are found here. In the Esbensen and Winfree study (1998) of a large sample of eighth graders in 41 schools in 11 cities, the percent in gangs was as follows:
Percent in a gang
Blacks 12.3
Hispanics 12.3
Whites 6.4
Results are similar in the main study (2001) of 15,292 teens (from 313 secondary schools across the country). The following lists the percentages who admitted they were in a gang:
Percent in a gang
Males
Blacks 13.4
Hispanics, 10.4
Whites 5.7
Asians 4.7
Females
Blacks 6.8
Hispanics 7.2
Whites 2.2
Asians 1.2
Gang membership prevalence among Hispanic males approaches that of blacks, and is roughly double that of whites. Compared to white females, Latino girls are more than three times as likely to belong to a gang.
Affiliation with a gang ranges all the way from a wannabe to a hardcore thug, and these surveys certainly include plenty of the former. But they are consistent with media and criminal justice depictions of violent gangs--both on the streets and in the prisons--being dominated by blacks and Hispanics. It is not imaginary.
As was shown in the last post, the best approach to such questions is to seek out the best data. I found two studies in which researchers surveyed adolescents about membership in a gang. Descriptions of each are found here. In the Esbensen and Winfree study (1998) of a large sample of eighth graders in 41 schools in 11 cities, the percent in gangs was as follows:
Percent in a gang
Blacks 12.3
Hispanics 12.3
Whites 6.4
Results are similar in the main study (2001) of 15,292 teens (from 313 secondary schools across the country). The following lists the percentages who admitted they were in a gang:
Percent in a gang
Males
Blacks 13.4
Hispanics, 10.4
Whites 5.7
Asians 4.7
Females
Blacks 6.8
Hispanics 7.2
Whites 2.2
Asians 1.2
Gang membership prevalence among Hispanic males approaches that of blacks, and is roughly double that of whites. Compared to white females, Latino girls are more than three times as likely to belong to a gang.
Affiliation with a gang ranges all the way from a wannabe to a hardcore thug, and these surveys certainly include plenty of the former. But they are consistent with media and criminal justice depictions of violent gangs--both on the streets and in the prisons--being dominated by blacks and Hispanics. It is not imaginary.
Wednesday, January 27, 2010
The myth of the myth of Hispanic lawlessness
Ron Unz has an analysis of criminal justice data in the American Conservative which finds that Hispanics don't really differ from whites in their levels of crime.
One limitation of the analysis is that it relies on data gathered far down the line from the actual criminal behavior. Between the act and incarceration rates are many steps: reporting the crime, arresting, prosecuting, convicting, and sentencing the defendant as well as deciding when he gets paroled from prison.
The data closest to the act is self-report data. The National Longitudinal Study of Adolescent Health (Add Health) is a longitudinal study of a nationally representative sample of adolescents in grades 7-12. In the study, 3,911 whites and 719 Hispanics answered if they had committed the crimes listed in the table below. Percentages are displayed as well as the ratio of the Hispanic to white rates.

Of the 15 delinquent acts listed, Hispanics have the higher rate 14 times. Ratios range from 0.95 to 2.33.
Critics might respond that surveying adolescents captures minor crimes, while data on prisoners, for example, captures serious criminality. But you can see that respondents were asked about very serious crimes as well as about less serious ones. For example, Hispanics are 2.33 times more likely than whites to have stabbed or shot someone (and the difference is statistically significant).
One limitation of the analysis is that it relies on data gathered far down the line from the actual criminal behavior. Between the act and incarceration rates are many steps: reporting the crime, arresting, prosecuting, convicting, and sentencing the defendant as well as deciding when he gets paroled from prison.
The data closest to the act is self-report data. The National Longitudinal Study of Adolescent Health (Add Health) is a longitudinal study of a nationally representative sample of adolescents in grades 7-12. In the study, 3,911 whites and 719 Hispanics answered if they had committed the crimes listed in the table below. Percentages are displayed as well as the ratio of the Hispanic to white rates.

Critics might respond that surveying adolescents captures minor crimes, while data on prisoners, for example, captures serious criminality. But you can see that respondents were asked about very serious crimes as well as about less serious ones. For example, Hispanics are 2.33 times more likely than whites to have stabbed or shot someone (and the difference is statistically significant).
Less sex among educated not due to age
Some readers thought that the less frequent sex by educated people reported in the last post was due to differences in age. I limited the sample to married whites ages 30-35 (N =173):
Mean frequency of sex in past 30 days
No degree 17.20
GED 8.80
High school 6.33
AA 5.27
BA 4.88
MA 5.38
PhD 4.72
Same pattern.
Mean frequency of sex in past 30 days
No degree 17.20
GED 8.80
High school 6.33
AA 5.27
BA 4.88
MA 5.38
PhD 4.72
Same pattern.
Tuesday, January 26, 2010
Education and sexual frequency
Reader FeministX suggested that I take a look at the frequency of sex among white married couples by education. Here are the means for the past 30 days (N = 852):
Mean frequency of sexual intercourse in past 30 days
No degree 16.27*
GED 12.00*
High school 8.08*
AA 9.14*
BA 6.30
MA 5.97
PhD 5.62
Those with less than a BA have significantly more sex than couples with 4 or more years of education. At the extremes, married whites with no degree have three times as much sex as PhDs. Educated folks prefer the bookie to the nookie.
Mean frequency of sexual intercourse in past 30 days
No degree 16.27*
GED 12.00*
High school 8.08*
AA 9.14*
BA 6.30
MA 5.97
PhD 5.62
Those with less than a BA have significantly more sex than couples with 4 or more years of education. At the extremes, married whites with no degree have three times as much sex as PhDs. Educated folks prefer the bookie to the nookie.
Monday, January 25, 2010
Education and anal sex
Reader SFG suggested that I examine the claim that smart people are more likely to have anal sex because they are kinkier. Education will have to serve as a proxy measure. Here are the results for married whites from the National Couples Survey data (N = 903):
Percent having anal sex in past four weeks
No degree 28.3*
GED 19.4*
High school 10.4
AA 9.9
BA 7.4
MA 6.9
PhD 4.9
* p < .05, two-tailed test, compared with BA.
Just the opposite. Anal is prolish behavior. Educated women don't go for that.
Percent having anal sex in past four weeks
No degree 28.3*
GED 19.4*
High school 10.4
AA 9.9
BA 7.4
MA 6.9
PhD 4.9
* p < .05, two-tailed test, compared with BA.
Just the opposite. Anal is prolish behavior. Educated women don't go for that.
Friday, January 22, 2010
Race and anal intercourse
The National Couples Survey asked married people if they've had anal intercourse in the past four weeks. Here are their responses by race/ethnicity:
Percent
Whites 12.1
Blacks 23.6*
Hispanics 29.6*
Asians 12.2
American Indians 30.4*
*p < .05, two-tail test, compared with whites
The numbers are much higher for NAMs (non-Asian minorities). Would this be an indication of male dominance as well as of freakiness?
Percent
Whites 12.1
Blacks 23.6*
Hispanics 29.6*
Asians 12.2
American Indians 30.4*
*p < .05, two-tail test, compared with whites
The numbers are much higher for NAMs (non-Asian minorities). Would this be an indication of male dominance as well as of freakiness?
Wednesday, January 20, 2010
Race, class, and domestic violence
According to the conventional wisdom, blacks are more violent than whites because of poverty. Researchers, who are supposed to get beyond the cliches, have rarely tested this idea, and it doesn't help that the relevant data is scarce.
The National Couples Survey asked married people (N = 1,181) if they had ever had a "physical argument." I limited the sample to respondents who had graduated high school--but who had gone no further--in order to eliminate variation in social class. Here are the percentages saying there has been physical fighting in the marriage:
Percent
Whites 10.9
Blacks 28.6*
Hispanics 23.2*
Asians 17.9
American Indians 20.0
* p < .05, two-tailed test, compared with whites.
Married blacks at the same level of education as whites are almost 3 times more likely to be violent. Hispanics are more than twice as likely. Sample sizes are so small, the Asian/white and Amerindian/white differences are not significant.
The National Couples Survey asked married people (N = 1,181) if they had ever had a "physical argument." I limited the sample to respondents who had graduated high school--but who had gone no further--in order to eliminate variation in social class. Here are the percentages saying there has been physical fighting in the marriage:
Percent
Whites 10.9
Blacks 28.6*
Hispanics 23.2*
Asians 17.9
American Indians 20.0
* p < .05, two-tailed test, compared with whites.
Married blacks at the same level of education as whites are almost 3 times more likely to be violent. Hispanics are more than twice as likely. Sample sizes are so small, the Asian/white and Amerindian/white differences are not significant.
Tuesday, January 19, 2010
Childhood religion and political orientation

I'm currently reading Witness by Whittaker Chambers. He was an intelligent boy who grew up with no religion. Despairing over the world that was dying in the 1920s, he joined the Communist Party as a young man. Also despairing, his brother ended his life with his head in an oven.
These were sensitive boys, but it made me wonder if being smart and growing up with no religion is a risk factor for radical politics.
The graph shows current political orientation by religious affiliation when the respondent was age 16. I limited the analysis to whites and to those with a perfect score on a vocabulary test--a decent measure of IQ.
Those who were either Jewish or nothing as teens are more likely than Christians to be extremely liberal. (I'm afraid "communist" is not an option.)
(It's stunning that only 9 percent of smart people raised Jewish are slightly conservative, conservative, or extremely conserative.)
But notice how people growing up with no religion are also more likely than others to be extremely conservative. The difference is not statistically significant, but it is possible that being raised Christian has a moderating effect on one's politics.
Monday, January 18, 2010
Blacks least likely to smoke crack??

Huh? According to self-report data from the 2008 Monitoring the Future (N = 11,702), white (and Hispanic) high school seniors are significantly more likely to have smoked crack than blacks. The precise estimates are like this: Hispanics, 3.4%; whites, 2.7%; and blacks, 1.2%.
I've got to finish reading the article, but I will soon describe another study showing that blacks are more likely to give socially desirable answers to survey questions.
Sunday, January 17, 2010
Among high school seniors, Hispanics are least likely to have a job

We saw in a recent post that Hispanics in high school skip classes more than others. Well, it's because they're working, right, which might not be ideal, but hey, at least it's not hanging out on the street corner or something. The only problem is that Hispanic teens attending school are less likely to have a job than whites.
The graph (N = 11,758, 2008 Monitoring the Future) shows that 73 percent of white seniors have some kind of part-time work. This is compared to only 61 percent of Latinos (and 62 percent of blacks). Whites get better grades, even though they spend more time working.
Friday, January 15, 2010
Kids who go to church are less likely to smoke pot

We saw in a recent post that high school seniors who are Democrats are more likely to use marijuana than Republicans. The above graph shows the same pattern for seniors who never go to church (N = 1,606, 2008 Monitoring the Future). Twenty-two percent of them have smoked pot 40 or more times, compared to only seven percent of those who attend religious services at least weekly. The difference is statistically significant.
Thursday, January 14, 2010
From Gallup:
When Gallup analyzed in detail the migration desires of citizens around the world, so many Haitians told us they would move permanently to another country if given the chance that the country would, in theory, lose 50% of its population if those wishes were fulfilled.
Wednesday, January 13, 2010
Pot is for losers

Monitoring the Future (2008) surveyed 6,873 high school seniors. You can see in the graph that smoking pot is associated with being a Democrat. For example, a strong Democrat is 1 1/2 times more likely than a strong Republican to have used marijuana 40 or more times (15 versus 10 percent). The difference is statistically significant. So for every 100 conservative potheads, you get 150 who are liberal (if the two groups were equal in size). Democrat dissipation starts early.
While were at it, look at how use varies by GPA:
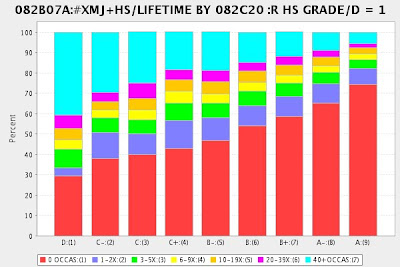
Pot is for losers.
Tuesday, January 12, 2010
Hispanic seniors are more likely than blacks to skip class

This graph is based on data from the 2008 Monitoring the Future sample of 11,295 high school seniors. The title of the graph is not clear: it is the number of times that a student skipped a class in the past 30 days.
You can see that blacks and Hispanics are more likely to skip than whites. Black attendance is actually better than that of Latinos. And the sample is of students present the day of the survey, so it omits many who attend irregularly or who have dropped out completely. (Roughly half of Hispanics drop out). Hispanic commitment to education is clearly lower than for other groups.
In connection with the last few posts, truancy data also point to lower conscientiousness among NAMs. Or is it those nasty, hate-filled white teachers that make the kids not want to go to class?
Monday, January 11, 2010


More indicators of conscientiousness
Here are more indicators from the National Health Interview Survey (2008) of greater conscientiousness among Asians:
And of lower conscientiousness among blacks and Hispanics:
- When results are considered by single race without regard to ethnicity, 10% of Asian adults were current smokers compared with 21% of black adults, 21% of white adults, and 23% of American Indian or Alaska Native adults.
- Asian adults were more likely to be lifetime [alcohol] abstainers compared with other single race groups (excluding Native Hawaiian or Other Pacific Islander).
And of lower conscientiousness among blacks and Hispanics:
- Regarding vigorous leisure-time physical activity, 55% percent of non-Hispanic white adults never engaged in periods of vigorous leisure-time physical activity compared with 66% of non-Hispanic black adults and 69% of Hispanic adults (no number was given for Asians).
Sunday, January 10, 2010
Race, ethnicity and obesity
According to a CDC report:
The last comparison is consistent with a comment made on this blog some time ago that Hispanics are more likely to be overweight, but not REALLY fat.
UPDATE: I know there are other reasons why people are overweight, but the racial ordering is consistent with other facts that suggest greater conscientiousness among Asian Americans.
When results are considered by single race without regard to ethnicity, 55% of Asian adults were at a healthy weight compared with 37% of white adults, 29% of American Indian or Alaska Native adults, and 29% of black adults.
Black adults and American Indian or Alaska Native adults were about 3-4 times as likely to be obese as Asian adults. White adults were about three times as likely as Asian adults to be obese. When results are considered by single race and ethnicity, 36% of non-Hispanic black adults were obese compared with 31% of Hispanic adults and 26% of non-Hispanic white adults. Hispanic adults were more likely to be overweight (but not obese) than either non-Hispanic white or non-Hispanic black adults.
The last comparison is consistent with a comment made on this blog some time ago that Hispanics are more likely to be overweight, but not REALLY fat.
UPDATE: I know there are other reasons why people are overweight, but the racial ordering is consistent with other facts that suggest greater conscientiousness among Asian Americans.
The IQs of actors
I've seen discussions in the HBD community before about the IQs of actors. Actors certainly seem to think they're smart, but what does the GSS say?
In a sample of 20 actors and directors (who certainly boost the average) the mean IQ is 107.5.
I'm not impressed.
In a sample of 20 actors and directors (who certainly boost the average) the mean IQ is 107.5.
I'm not impressed.
Subscribe to:
Posts (Atom)
Are gun owners mentally ill?
Some anti-gun people think owning a gun is a sign of some kind of mental abnormality. According to General Social Survey data, gun owners ...

-
Via a reader at iSteve, it looks like this might be the vocabulary test used by the General Social Survey. (Someone please tell me if I'...
-
 In the comments in the last post , some readers contended that Jews are not ethnocentric. Using the same question I used in the comments se...
 -
Here's the second set I promised. A reader suggested that the first set tends to be older, and it is among younger blacks where you see ...
