Thursday, June 29, 2006
Sunday, June 18, 2006
A sketch of American Muslims: How do Muslims compare with others in America? I haven't seen many systematic descriptions of this community. Here's some stats from the GSS:
Mean age
U.S. 45.3
Muslims 36.9
Percent male
U.S. 45.3 (females are more often home when interviewer visits)
Muslims 68.5
Percent black
U.S. 14.4
Muslim 37.0
Percent foreign-born
U.S. 9.3
Muslims 72.2
Percent not finishing high school
U.S. 14.6
Muslims 13.0
Percent with at least bachelor's
U.S. 24.9
Muslims 31.5
Percent unemployed
U.S. 5.1
Muslims 1.9
Occupational prestige
U.S. 43.6
Muslims 44.6
Conservative scale
U.S. 4.11
Muslims 3.69
"Does not value citizenship" scale
U.S. 1.40
Muslims 2.20
Average number of children
U.S. 1.96
Muslims 1.59
Church attendance scale
U.S. 3.89
Muslims 4.64
Compared to the general American population; Muslims are younger; more male; blacker; more likely to have been born in another country; and more likely to have a bachelor's degree or higher. They are less likely to be without a job; they have similar occupational success; they are more liberal (contrary to what some conservatives have said); they value citizenship less (like all immigrants); they have fewer children; and they are more religious.
So they look somewhat different from the overall population, but perhaps they are not much different from many other immigrant group, except for being more religious and have a greater number of blacks in their ranks. It might be a good idea for me to compare them with immigrants next, and to look more deeply into their politics and religious beliefs. Is there anything you want me to look for?
Wednesday, June 14, 2006
"Moderate" often means apathetic: Moderates are often portrayed as responsible people, while strong conservatives or liberals are described as "extremists." In my experience, it is more accurate to divide people into two groups of "give a damn" and "don't give a damn." The GSS backs me up here. Respondents were asked how important politics and public life were to them, and answers ranged from 1 (unimportant) to 7 (very important). I calculated the average score for these groups:
Importance of politics
1. Extremely liberal 4.47
2. Conservative 4.34
3. Liberal 4.30
4. Extremely conservative 4.25
5. Slightly liberal 4.07
6. Slightly conservative 4.03
7. Moderate 4.03
Not only is politics relatively unimportant to moderates, they are less informed. Here is the percent who know who their U.S. Representative is:
Percent who know who U.S. Representative is:
1. Extremely conservative 91.7
2. Extremely liberal 88.9
3. Liberal 85.1
4. Slightly liberal 82.5
5. Conservative 80.9
6. Slightly conservative 80.3
7. Moderate 75.3
Tuesday, June 13, 2006
Those Cheatin' Chinamen: As a follow-up to the last post, I calculated the percent of American men and women who have cheated on their spouse in the last year for various ethnic groups (from the GSS). First, you can see that the men are twice as likely as the women to stray--no surprise there. Men have higher rates in all ethnic groups except for Mexicans. But let's focus on comparing groups, not gender:
Percent of married men who cheated in the last year
1. Chinese 10.6
2. Blacks 9.8
3. Puerto Ricans 8.4
4. American Indians 7.9
5. Mexicans 5.9
U.S. average 4.5
6. Spain 4.5
6. Scots 4.5
8. Dutch 4.4
9. Filipinos 4.3
10. French 3.8
10. English/Welsh 3.8
12. Germans 3.7
13. Italians 3.3
14. Russians 3.2
15. Irish 2.9
15. Swedes 2.9
17. Czechs 2.2
18. French Canadians 1.5
So this basically stacks up as white vs. non-whites, with the non-whites having hig rates of infidelity. The exception to this is the Filipinos who fall below the national average. And I thought the Chinese were supposed to have low sex drives! But notice how none of the Chinese women cheated:
Percent of married women who cheated in the last year
1. Mexicans 7.6
2. Puerto Ricans 6.1
3. American Indians 4.1
4. Blacks 3.0
5. Irish 2.8
U.S. average 2.3
6. Italians 2.3
6. French 2.3
6. Germans 2.3
9. Filipinos 2.2
10. Spain 2.1
11. English/Welsh 1.5
12. Dutch 1.4
13. Russians 1.2
13. Scots 1.2
15. Swedes 0.0
15. Chinese 0.0
15. Czechs 0.0
15. French Canadians 0.0
Other men and women have similar rankings, but Chinese women are at the bottom while the men rank first. Filipinos are again below the average, and Irish women are above it, but otherwise we see the same pattern of more cheating among non-whites, less among whites. White racism must drive them to it.
Monday, June 12, 2006
Mexicans are socially conservative, if you mean that men should have more than one woman--We social conservatives are told to celebrate the millions pouring in illegally from Mexico because they have the family values that Americans lack, right? According to the General Social Survey, 6.9% of Mexican Americans cheated on their spouse in the last year. This is more than double the rate for all Americans (3.3%). And you're wrong if you suspect this is just a male problem: 7.6% of Mexican women cheated. That's more than the men at 5.9%!
Sunday, June 11, 2006
Maybe crime doesn't have squat to do with lack of education
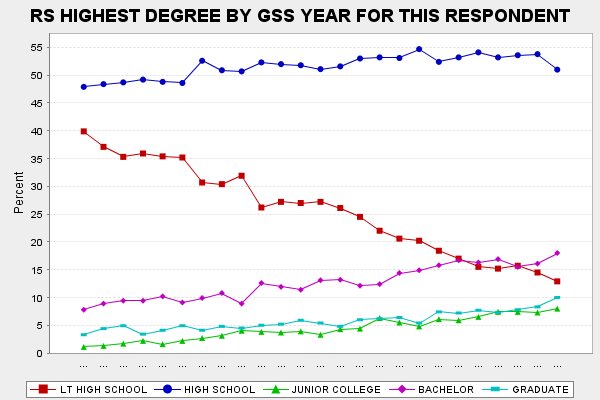
Have many times have you heard the liberal bromide that education is the key to the crime problem (and a host of other social ills)? I have always been skeptical of this idea, and it is one of those things experts always say and seem to think it is so obvious that nobody needs to bother to demonstrate it. I know the criminological research literature quite well, and the only thing I have seen documented is that kids who dislike school and perform poorly are considerably more likely to be delinquents. This tells us more about the kid than it does his education. In macrolevel research, eduational variables are often not included (which tells us they don't matter) and they don't seem to have much impact when you do actually see them analyzed. I'll guarantee you that, compared to percent graduated from high school, percent black is ten times the predictor of homicide rates.
The graph above (from the GSS) shows a large, steady decline in high school dropouts in the past 3 decades (look at the red line). While crime has been trending downward over the last decade or so, it was on the increase during the 70s and remained at a high level during the 80s. You might counter that we must focus on high risk groups, not the general population, but the overall trend was the same for young blacks, for example: the percent not finishing high school dropped from the 30s to the teens over this same period of time. And the sharpest drop was in the 1970s, the decade that saw more crime, not less.
Saturday, June 10, 2006
American Muslims are more against spanking than Jews: In my ongoing search to learn about American ethnic groups, I looked at the General Social Survey's question about favoring spanking as a form of discipline. Respondents' answers range from 1 (strongly agree) to 4(strongly disagree) so the higher the score, the more people dislike corporal punishment. Here are the rankings:
Mean anti-spanking score
1. Portuguese 2.50
2. Russians 2.39
3. Greeks 2.32
4. Indians 2.30
5. Filipinos 2.27
6. Swiss 2.26
6. Finns 2.26
8. Belgians 2.22
8. Lithuanians 2.22
10. Italians 2.21
11. French Canadians 2.20
12. Danes 2.19
13. Norwegians 2.18
14. Yugoslavs 2.13
14. Rumanians 2.13
16. Poles 2.11
16. Spain 2.11
18. Swedes 2.10
18. Irish 2.10
18. Hungarians 2.10
18. Austrians 2.10
22. French 2.09
22. Chinese 2.09
24. Puerto Ricans 2.07
24. Mexicans 2.07
26. English/Welsh 2.06
National average 2.05
27. Arabs 2.05
28. Czechs 2.04
28. Scots 2.04
30. Germans 2.03
31. Japanese 1.94
31. Dutch 1.94
33. American Indians 1.90
33. Blacks 1.75
35. West Indians 1.62
The tendencies: Americans from Eastern European and Scandanavian backgrounds don't like spanking, blacks and American Indians do. It surprises me that the Japanese like it, but the Italians do not.
I got curious about religion:
Muslim (not black) 2.68
Jewish 2.50
Hindu 2.31
Orthodox 2.30
No religion 2.25
Catholic 2.16
Buddhist 2.16
Protestant 1.91
Black Muslim 1.87
Big surprise--Muslims like spanking less than Jews! And I'm not surprised to see that my tradition--Protestantism--still likes to "whoop the tar out of 'em."
Friday, June 09, 2006
Noam Chomsky: I just watched Noam Chomsky on "Charlie Rose" and discovered he is exactly what the Left hates: he is an extreme genetic determinist. While I'm not as radical as all that, he provides me an excellent example of how to believe in genes and yet thrive in academia: just don't allow your beliefs about evolution have a whiff of influence on your thinking about anything, at least in the area of politics. Just convince yourself that genes are everything except that they are nothing. He has a knack for this kind of thinking: we need to shrink the government to nothing by first making it much, much bigger.
Thursday, June 08, 2006
In spite of all the noise about white wickedness, they are the best liked race: I looked at the General Social Survey to see how warmly people feel about various ethnic groups. Respondents were given a range of answers between very warm(1) and very cool(9). Here are the results:
Feelings toward blacks
Chinese 3.50
English/Welsh 3.66
Germans 3.69
Irish 3.58
Italians 3.34
Mexicans 3.67
Filipinos 4.38
American Indians 4.09
All white groups 3.64
All other races 3.78
Blacks 1.93
Feelings toward Hispanics
Blacks 3.53
Chinese 3.50
English/Welsh 3.75
Germans 3.73
Irish 3.72
Italians 3.31
American Indians 4.21
All white groups 3.63
Mexicans 2.05
Feelings toward Asians
Blacks 3.61
English/Welsh 3.82
Germans 3.78
Irish 3.78
Italians 3.64
Mexicans 3.48
American Indians 4.33
All groups 3.69
Chinese 2.79
Feelings toward whites
Blacks 3.36
Chinese 3.21
Mexicans 2.77
American Indians 3.49
West Indians 4.00
Whites 2.78
Okay, there is a lot here. I included a variety of larger ethnic groups and other groups if they had a particular dislike for the ethnic group in question. Blacks, Hispanics, and Asians have similar overall scores, indicating that these groups are equally less popular than whites. (I will say that Asians, surprisingly, might be the least liked of the groups). Only one group expressed coolness toward whites--West Indians.
Of all ethnic groups, American Indians liked other groups the least. Blacks and Hispanics liked themselves the most--whites and Chinese liked themselves the least. But more precisely, Chinese rated Asians, not just other Chinese, so it is likely that, while various ethnic groups like whites the best, they like themselves the least. In fact, Mexicans like whites as much as whites like themselves.
Is religion impotent? Nobody likes the idea better than I do that belonging to a religion influences attitudes and behavior (usually for the better), but the case of the Catholic church (which I also like very much) provides little evidence for this. You would expect Catholics to oppose abortion, condom use, and capital punishment, and to have more children than other Americans. Let's compare them to Protestants:
Percent in favor of abortion on demand
Protestants 36.1%
Catholics 35.4
(Jews 78.4!)
Percent in favor of death penalty
Protestants 74.0%
Catholics 74.7
Percent using condom last time one had sex
Protestants 18.6%
Catholics 22.0
Average number of children
Protestants 2.04
Catholics 2.08
Evidently, all that doctrine and preaching and enculturation of the youth has precisely zero impact on adherents. You might say that we see no impact because Catholics never go to church and never learn this stuff, but according to the GSS, 36% go at least once a week. Thank God religion gives people meaning, or from a practical, earthly stance, what would be the point of it?
Tuesday, June 06, 2006
Are gays really sad? Being denied the ability to marry, are gays unhappy (and s0 perhaps should be called "sads" instead)? According to the GSS, these are the percentages of unhappy people:
straight men 9.1%
gay men 9.9
bisexual men 23.1
straight women 10.1%
lesbians 13.1
bisexual women 15.9
Gay men are the second happiest group, behind hetero men. What guy wouldn't be happy to get non-committal sex whenever he wanted it? As we saw in an earlier post, it's the bisexuals who are troubled. Perhaps we should legalize bisexual marriage. If we did, it would have to be a union of two men and two women so each partner has a partner of each sex. Or it could be three if some partners were hetero. Or if some partners were gay. But now I'm confusing myself. But anyway, for me to be fulfilled, I'd say my nature requires, hmmm, 3 wives: one new young wife each decade until I'm too old to care.
Chinese Americans like the death penalty--blacks do not: According to the General Social Survey, almost 9 out of 10 Americans of Chinese ancestry favor the capital punishment. A clear majority in all ethnic groups feel the same way, except for blacks and West Indians:
1. Chinese 86.5%
2. Rumanians 82.6
3. Yugoslavs 81.2
4. Czechs 81.1
5. Greeks 80.8
6. Hungarians 80.6
7. Germans 79.8
8. Poles 79.4
8. English/Wales 79.4
10. Scots 79.7
11. French Canadians 79.2
12. Italians 78.3
13. Netherlands 77.3
14. Swedes 76.8
15. French 76.1
16. Belgians 76.0
17. Austrians 75.9
18. Danes 75.8
19. Irish 75.0
20. Japanese 74.4
U.S. average 73.6
21. Arabic 73.2
22. Swiss 72.9
22. Lithuanians 72.9
24. Norwegians 72.8
25. American Indians 71.9
25. Mexicans 71.9
27. Jews 71.7
28. Russians 70.8
29. Finns 70.7
30. India 70.4
31. Spain 69.6
32. Portugal 69.1
33. Filipinos 65.1
34. Puerto Ricans 60.5
35. Blacks 49.2
36. West Indians 47.8
Looking for patterns, Eastern Europeans are generally pro-death penalty, while poor minority groups are at the bottom of the list. We saw in the previous post that these groups are most willing to keep pot illegal, suggesting as Agnostic wrote, that these groups are more authoritarian. A dislike for capital punishment may reflect the view that it is imposed in a racially biased way. (It is not: the disproportionate number of minorities on death row is due to high rates of robbery-murders committed by these groups--the type of murder that qualifies as a capital crime). It is interesting that Arabs are average. I am getting the impression from GSS data that Arabs in America are surprisingly assimilated.
Monday, June 05, 2006
Who favors making marijuana legal? Some readers have suggested that being in favor of legalizing MJ is a conservative position. It certainly is a libertarian one, but let's look and see what kind of people believe this way. Let's begin with political orientation:
Percent in favor of MJ legalization
Extremely liberal 64.2%
Extremely conservative 19.2
Sociologically speaking, it is clearly a liberal position. But I wanted to make a sketch of the pro-legalization camp. Here's a list:
U.S. total in favor: 34.8%
18-30 year-olds 43.4
Graduate degree 44.3
Never attends church 52.7
Pacific region 42.9
Russian ethnic group 50.0
And poor minority groups were most against it:
Blacks 26.3%
Mexicans 25.9
Puerto Ricans 23.7
So the GSS indicates that the people who want marijuana to be legalized the most are young, educated, secular whites, especially those who are very liberal. By contrast, three-quarters of people from poor, less educated minority groups are against it. Perhaps they have seen the costs of abuse most closely, or are more comfortable with criminalizing undesirable behaviors.
Sunday, June 04, 2006
More people say they are conservative, but want more spending


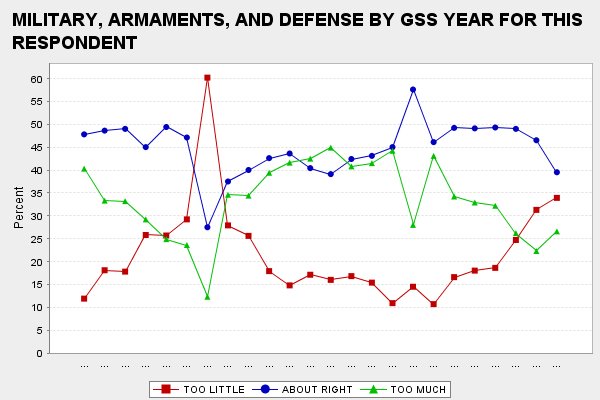
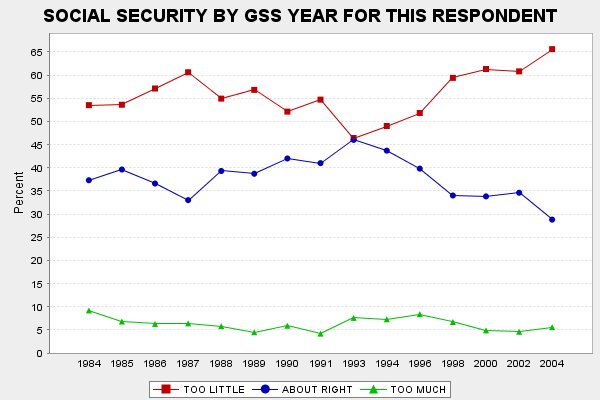

A reader suggested that I analyze in more detail the trends in politcal views. The graphs above display the issues where there have been noticeable changes. (The red line represents people who feel were are not spending enough--in the case of marijuana, it is the percent in favor of legalization). With only one issue--military spending--do we see a conservative trend. Republicans have benefitted from the post-9/11 concern over security, but it is interesting that the pro-military trend started in the late 1990s.
More people feel we are not spending enough on education, health, and social security. So how is it that more people are also calling themselves conservative? Perhaps it has come to be associated with a tough-minded person as opposed to the unappealing image of the kooky liberal, or as a reader wrote, perhaps people equate "conservative" with "Republican," and nowadays being a Republican and being in favor of spending is not seen as incompatabile.
I have heard people say that the country is split into thirds: liberals, moderates, and conservatives. This is inaccurate:
Liberals 24.4%
Moderates 38.0
Conservatives 37.6
One the one hand, 75% of the country says it is not liberal, and there are as many conservatives as moderates, but on the other hand, conservative seems increasingly to mean "liberal (pro-spending) but not crazy." Of course, no one says they want to be taxed more: exactly 1.5% say we don't get taxed enough.
Saturday, June 03, 2006
Andrew Sullivan knows less about how people feel about homosexuality than I do (and I'm nobody and straight and don't care): In recent debate that included Pat Buchanan, Andrew Sullivan said that the culture war that Pat talks about exists only among the Baby Boomers--generation Xers have all agreed that abortion and gay marriage are just fine. Well, Andy needs to broaden his circle (how big can the gay neo-con circle be?).
Here's a comparison of Boomers and Xers on the percent who believe in abortion on demand and who feel that homosexuality is not wrong:
Abortion on demand
Boomers 47.1%
Xers 35.5
Homosexuality okay
Boomers 35.5%
Xers 32.1
Xers are more conservative, not less, on these key cultural issues, and they are obviously just as divided as Boomers. It's humorous just how often pundits are full of it.
In the past few decades, have Americans moved right? Berkeley political scientist Paul Pierson has written that the Republican Party has moved sharply right in the last three decades and has been very successful in spite of the fact that the American public has not moved right at all during the same period. (He argues that they have been so successful because they are more cunning and unified than Democrats, and their going against the public's will has undermined democracy). But is this core claim of his true that Americans have not shifted? Since 1974 the GSS has asked respondents to describe themselves on a range between extremely liberal and extremely conservative. I calculated the mean score for all the years available from 1974 to 2004. Here are the numbers for each decade (4=moderate and higher numbers are more conservative):
1974: 3.98
1984: 4.17
1994: 4.17
2004: 4.23
And the trend is stronger when we only look at the people who actually vote:
1974: 3.97
1984: 4.22
1994: 4.19
2004: 4.34
So Pierson is wrong, they have gotten more conservative. On the one hand, the move to the right has only been 1/3 of a standard deviation, but in politics even small shifts can swing elections.
Extremely liberal atheists are most likely to think there is nothing wrong with teenage sex: A reader suggested I identify that very small group of Americans (2.7%) who think that sex between teens ages 14 to 16 is not wrong. I looked at just about anything I could think of and found that the following groups were most accepting: men, blacks, and especially people who do not believe in God, or who are extremely liberal. Examining all factors together produces very small cell sizes, so if we only look at the two strongest predictors--extremely liberal atheists--the percent who think teen sex is okay is 36.4%.
Friday, June 02, 2006
Black male college students have a sinister view of the world: I've noticed something very interesting in the classroom with black guys (at least the vocal ones). They are uniformly drawn to sinister views of the way the world works. All people are on the take. There isn't an honest person on the entire planet. Human motivation is universally greedy and exploitative. Conspiracy theories are the true ones. Jews have too much influence. Corruption is everywhere, and so you can hardly blame someone for unethical behavior. This doesn't appear to be the result of what is learned in class because there is no pattern of this among other students who take basically the same classes (most of my students are social science majors). I don't see the same pattern among black females. And in my experience, this is not just a noticeable tendency: no talkative black guy has ever communicated a different view.
Subscribe to:
Posts (Atom)
Are gun owners mentally ill?
Some anti-gun people think owning a gun is a sign of some kind of mental abnormality. According to General Social Survey data, gun owners ...

-
 In the comments in the last post , some readers contended that Jews are not ethnocentric. Using the same question I used in the comments se...
 -
Via a reader at iSteve, it looks like this might be the vocabulary test used by the General Social Survey. (Someone please tell me if I'...
-
I've been distributing a questionnaire to students which, among other things, asks them their religion. Quite a few have answered "...