Miami is like a Third World country: Governor Jeb Bush got huffy the other day when Tom Tancredo said that Miami is like a Third World country. Bush and other Florida lawmakers responded with the usual doublespeak, using words like "hospitality" and "vibrant."
Like always, we must ignore what the politicians say, and must rely on data. According to the Census, here is how Miami compares to the rest of the country:
Percent Hispanic
Miami 65.8
USA 14.1
Percent speaking something other than English at home
Miami 74.6
USA 17.9
Percent of people ages 25+ with high school degree
Miami 52.7
USA 80.4
Homeownership rate
Miami 34.9
USA 66.2
Percent poor
Miami 28.5
USA 12.5
Let's see: the city is a place where most people are Hispanic, Spanish-speaking, 1/2 never finished high school, few own homes, and many are poor. Sounds like the Third World to me. And it's coming to your neighborhood next.
Tuesday, November 28, 2006
Who's crazier: blacks or whites? The General Social Survey asked respondents if they had ever experienced a mental health problem. The only two groups large enough to examine are blacks and whites, and 5.3% and 7.7% said yes, respectively. These numbers parallel the racial pattern of suicide. Now, the racial activists tell us that are society is rife with racism, but if that were the case wouldn't mental illness be much more common in blacks? If I were surrounded every day by people who hate me, it might very well take its toll on my sanity. You might respond that prejudice is indeed pervasive, but blacks possess the mental strength to overcome it and even surpass whites in psychiatric health. But oops--now you have violated your own taboo against positing natural mental differences between races.
Other data indicating that Mex-Ams are ethnocentric and strongly tied to Mexico: In earlier posts, I presented evidence from the General Social Survey (GSS) that Mexican Americans are comparatively ethnocentric. Another way to look at it is to see how many of them see themselves as "American only"--people with no roots anywhere except for here. According to the GSS, Mexicans are 5.2% of the population but are only 2.3% of those saying they are only American. Blacks, for example, are much more likely to say yes to this question, even though they could easily identify with Africa if they chose to.
Which Americans have the most sex partners? General Social Survey participants were asked how many different partners they had in the past year. I calculated the mean for 18-30 year olds from ethnic groups with at least 100 respondents:
Mean sex partner in last 12 months (women in parentheses, then the sex difference):
Blacks 2.39 (1.44) +.95
Irish 1.92 (1.36) +.56
Italians 1.85 (1.19) +.66
American Indians 1.83 (1.38) +.45
Mexicans 1.73 (1.48) +.25
USA 1.74 (1.32) +.42
Germans 1.53 (1.21) +.32
English/Welsh 1.51 (1.28) +.23
Blacks have been characterized as the most sexual race, but according to GSS data, this is more true of black men. Mexican American women report more partners than do their black counterparts. Other surveys portray black women as being somewhat conservative about sex. And while other studies also suggest that blacks have more partners, they often do not find that blacks have sex more often, or that they engage in more novel kinds of sex (e.g., anal). In a well-respected study described in the Social Organization of Sexuality, Hispanics had the most sex, and were the most experimental.
The women's rankings tend to follow the men's: the number of partners a woman has are, in part, due to the kind of men she is dealing with. If she is sleeping with someone, she probably wants to keep him, and if she is sleeping with multiple guys in a year, the guys are not sticking around. There is also a pattern of more gender-traditional groups having the biggest sex differences (Italian guys can sleep around, but not the girls).
As we have seen with many kinds of behavior that grandma wouldn't like, rates are highest among non-whites, or among whites from Catholic or southern European countries. (Drinking is an important exception). You and I might not think any group is ultimately superior to another, but Grandma is starting to think that whites from traditionally Protestant countries (and perhaps East Asians and Jews if I studied them more) are.
Friday, November 24, 2006
GSS data cast doubt on the idea that immigrants will shift our values right: Will Mexican immigrants bring a more Catholic tinge to politics? General Social Survey respondents were asked if they approved of abortions for any reason. Below is the percent difference between groups:
Percent difference in approving of abortion for any reason
Mexican Immigrant--All Americans, -17.2%
American-born of Mexican ancestry--Total American-born (ages 26+), -10.1%
American-born of Mexican ancestry--Total American-born (<25), -2.9%
Indeed, Mexicans immigrate with views less favorable to abortion than the average American, but in subsequent generations and among younger Mexican Americans, the gap closes. From these data, America shapes the moral values of immigrant families more than the reverse. These data also say poppycock to neocons who argue that Latinos will move the country in a traditional direction.
Thursday, November 23, 2006
Poor Americans are not poor: Thanksgiving Day has got me thinking about abundance and poverty. Students moan in my class about how poor so many Americans are. I looked at the American Community Survey to see what percent of poor Americans own a house. According to the 2000 sample of 52,830 of Americans making less than $20,000 annually total household income, 30.4% own a house free and clear, 17.8% own with a mortgage or loan, and 51.8% rent. The modal home owned has 3 bedrooms. A Third Worlder would giggle if you told him that 1/2 of poor Americans owned a house with 3 bedrooms. That ain't poor, baby.
Wednesday, November 22, 2006
Is the unemployment-crime link stronger for blacks or whites? In his latest VDARE column, Steve Sailer writes that young, black men are more likely to cause trouble if unemployed compared to other groups. (This was not his main topic, but even his small points are food for thought). In my mind, it could go either way: unable to make a living, the young black man turns to crime while the young white guy sits in his parents' place playing with his new Playstation 3; or a white guy who doesn't have a job is, on average, more troubled and more likely to commit crimes than the unemployed black guy who lives in an envirnoment where not having a job is not that unusual.
I looked at General Social Survey males ages 18 to 22 and compared "active" and "inactive" blacks and whites--"active" means working part- or full-time or in school. Twenty-five percent of active whites report having been arrested compared to 45% of inactive whites. For blacks, arrest rates are 40% for actives and 50% for inactives. From these numbers (and we should view them with caution since the sample size is only 391) an inactive status differentiate whites in terms of criminal behavior more than it does blacks. As with all correlational research, the causal relationships here are difficult to identify. Based on these data, I would say that inactivity is a measure of certain personality traits (e.g., shiftlessness) that lead to crime, and the measure is more valid for whites than blacks.
I looked at General Social Survey males ages 18 to 22 and compared "active" and "inactive" blacks and whites--"active" means working part- or full-time or in school. Twenty-five percent of active whites report having been arrested compared to 45% of inactive whites. For blacks, arrest rates are 40% for actives and 50% for inactives. From these numbers (and we should view them with caution since the sample size is only 391) an inactive status differentiate whites in terms of criminal behavior more than it does blacks. As with all correlational research, the causal relationships here are difficult to identify. Based on these data, I would say that inactivity is a measure of certain personality traits (e.g., shiftlessness) that lead to crime, and the measure is more valid for whites than blacks.
Tuesday, November 21, 2006
Lynching is ancient history
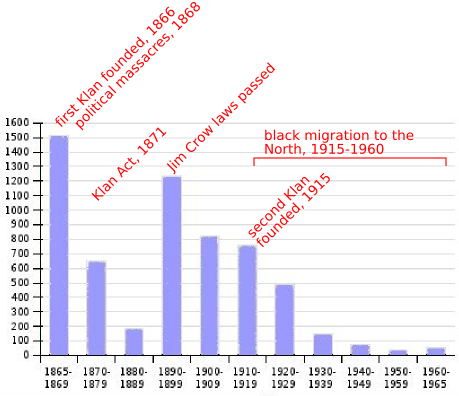
An anonymous reader cited statistics in my earlier post, presumably to show that lynchings were a larger problem than I indicated. My main point was not that lynching was not a serious problem, but rather that most incidents happened prior to 1950. Allow me to comment on the reader's numbers. The first study he cites by Raper is for the years 1989 to 1930. The period from the 192os to the 1930s saw a huge decline in lynchings. This is shown in the above graph. The whole decade of the 1950s--a troubled time for race relations--experienced only 6 black executions. This was the point of my post: there have been very few black lynchings in the last 50 years. Race activists paint a picture of America that has been murdering blacks up until the week before last, but you have to go back 80 years before you find 50 of these victims in a year among a population of over 10 million people.
Let's get some perspective here. With 6 lynchings in the decade of the 50s with 15 million blacks, the annual risk of this kind of murder was .00399 per 100,000 blacks. According to the CDC, the risk of murder for blacks--a crime usually perpetrated by another black--was 21.7 per 100,000 in 2003 (most recent year available). That risk is 5,439 times higher than the risk of being lynched in the 50s. Even if some lynchings were never recorded, there is no possible way that these two risks are in the same ballpark.
I also notice some things in the numbers cited. An accusation of rape was generally not the motivation for the killing, so it is myth that lynchings were motivated by whites who were hysterical about black male/white female sexual contact. In the two cites, lynchings of whites are not directly discussed. According to the source I cited (evidently the same source used by Wikipedia which was also cited) over that same period of 1882-1968, 27.4% or 1,297 of lynch victims were white. It is convenient to ignore white victims since it is easier to portray this phenomenon as pure, rabid hate crime instead of something much more complicated.
I also notice some things in the numbers cited. An accusation of rape was generally not the motivation for the killing, so it is myth that lynchings were motivated by whites who were hysterical about black male/white female sexual contact. In the two cites, lynchings of whites are not directly discussed. According to the source I cited (evidently the same source used by Wikipedia which was also cited) over that same period of 1882-1968, 27.4% or 1,297 of lynch victims were white. It is convenient to ignore white victims since it is easier to portray this phenomenon as pure, rabid hate crime instead of something much more complicated.
Monday, November 20, 2006
How common were black lynchings 50 years ago? After watching what seemed like an hour-long press conference on CNN--the most trusted name in news--where Paul Rodriguez (a co-owner of the Laugh Factory where Michael Richards performed) argued with a foaming-at-the-mouth black audience over the Richards flap, my principal reaction was "Michael Richards is Jewish? I didn't know that."
Later, I wondered if it were true, as Richards said, that fifty years ago a disrespectful black man would find himself "upside down with a fork up his ass." Precisely, how common was lynching in 1956? According to the Tuskegee Institute, the exact number of cases in 1956 was ZERO .
Later, I wondered if it were true, as Richards said, that fifty years ago a disrespectful black man would find himself "upside down with a fork up his ass." Precisely, how common was lynching in 1956? According to the Tuskegee Institute, the exact number of cases in 1956 was ZERO .
Saturday, November 18, 2006
Mexican women are the most criminal in America: I've looked at crime before on this blog, but have not focused on female criminality. Here are the percent who reported to the General Social Survey that they have ever been arrested:
Percent of American women arrested (sample size in parentheses):
Mexicans 9.3 (108)
French 6.1 (114)
Blacks 5.9 (404)
Italians 5.6 (269)
American Indian 4.8 (187)
Germans 4.7 (844)
USA 4.6 (4,626)
Scots 4.6 (131)
Irish 4.5 (581)
Poles 3.8 (159)
English/Welsh 2.8 (647)
I swear I'm not making this up: Mexican women have rates higher than any other group. Blacks and Southern Europeans also have high numbers, while other Europeans and American Indians are average or low.
Many blacks say that Jews are "bloodsuckers": Just about the only American not (weakly) portrayed as an anti-Semite, homophobe, or Jesus freak in "Borat" was the angelic black prostitute who eventually became the protagonist's wife. Yes, blacks remain the icons of humanitarian virtue.
The Survey of Chicago African Americans asked 639 blacks the following question: "Louis Farrakhan, the head of the Black Muslims may be a little extreme to describe Jews as 'blood suckers', but there's a lot of truth to it all the same. Do you agree strongly, agree somewhat, disagree somewhat or disagree strongly?"
One-third said they agree (strongly or somewhat). You're going to have to go to Stormfront.org to get a higher number than that.
Thursday, November 16, 2006
Evidence that Mexicans are the most ethnocentric group in America: As I just wrote about, the General Social Survey asks respondents about their ethnicity and records a second ethnic group if you mention one. If you don't mention a second, they record again the first ethnicity you mentioned. While most Americans have a mixed family tree, many feel a connection to just one branch. This varies by primary ethnic group. Let's see what percent report no identity except their main one:
Percent saying they have only one ethnicity
Mexicans 73.9
Blacks 51.6
American Indian 51.6
Italians 41.5
French Canadians 35.8
Yugoslavs 34.0
Norwegians 33.2
Irish 32.1
English/Welsh 29.9
Czechs 26.0
Poles 25.8
Scots 23.6
Finns 23.5
Swedes 22.9
Austrians 22.6
Russians 21.4
Portuguese 20.6
Danes 20.2
Hungarians 20.2
Germans 19.6
Dutch 17.8
Rumanians 17.4
Lithuanians 15.6
French 14.5
Greeks 14.3
Swiss 12.7
Spain 12.6
Non-whites are much more likely to see themselves as belonging to one group, and as we saw in the earlier post, on the rare occasion when they report a second ethnicity, it is also typically non-white. Mexicans take the lead: most are Mexicans and nothing else. Mexicans are more Mexican than Blacks are Blacks. While many of us see ourselves as multi-ethnic, here is evidence of strong Mexican ethnocentricity.
Wednesday, November 15, 2006
We are all Germans now: Many of my posts deal with American ethnic groups, but I always treat people as though they belong to one group. The General Social Survey recorded if respondents mentioned belonging to a second ethnic group. Here are their answers--the first is the main identity, the second is the most common second identity given, along with the percentage saying so:
Percent saying that the second group is their secondary ethnicity
Black--American Indian 25.8%
German--English/Welsh 20.6
Irish--German 19.3
English/Welsh--German 19.9
Mexican--American Indian 5.7
Italian--Irish 13.2
Scottish--English/Welsh 24.9
Austrian--German 25.0
French Canadian--Irish 22.6
Czech--German 22.0
Danish--German 19.3
Finnish--German 17.6
French--German 19.7
Greek--German and Italian 19.1
Hungarian--German 17.1
Dutch--German 25.0
Norwegian--German 23.7
Polish--German 17.2
Russian--German 28.3
Spanish--Mexican 36.3
Swedish--German 20.1
Swiss--German 40.5
American Indian--Black 14.3
The first thing that jumps out at me is how common German is as a secondary identity! Of course, this is a large American group, but I can't help thinking that perhaps Germans have been very open to intermarrying, or that of the many ancestries that mutt Americans have, German is one that is remembered for some reason. It is also interesting that poor minority groups only have some other poor minority group as their secondary ethnicity.
Spirituality is unrelated to education: I assumed that intelligence would be positively correlated with "feeling connected with all life." While unintelligent people have strong feelings for specific friends, relatives, or enemies, I imagined that only smart people would feel a bond with an abstraction. I was wrong: according to the General Social Survey, the correlation between years of education and feeling connected is a whopping .02.
Do men and women differ in spirituality? Just a few posts below, I looked at how spiritual various ethnic groups are. Let's compare men and women now.
Men
Mexicans 3.12
Blacks 3.11
American Indians 3.05
Scots 3.00
Irish 2.98
USA 2.80
English/Welsh 2.67
Germans 2.66
Italians 2.52
Women
Scots 3.63
Blacks 3.33
English/Welsh 3.17
American Indians 3.16
Germans 3.15
USA 3.11
Italians 3.07
Mexicans 2.68
Irish 2.83
First, we can see that women are more spiritual than men, but the differences appear to be smaller than with church attendance (earlier post). Comparing ethnic groups, Mexican men are comparatively spiritual, but Mexican women are not. The pattern is similar but less striking for Irish Americans. The pattern is reversed for Germans and English/Welsh. But we can't make to much of small differences since sample sizes are small.
Tuesday, November 14, 2006
Religious involvement by sex and ethnicity: Steve Sailer suggested I post on the gender differences in spirituality and religious attendance. Let's begin with the latter. Here are mean scores broken out by ethnic group and sex:
Men
Blacks 3.95
Mexicans 3.91
Irish 3.62
Germans 3.57
USA 3.55
English/Welsh 3.44
Italians 3.39
Scots 3.29
American Indians 3.21
Women
Blacks 4.83
Mexicans 4.51
English/Welsh 4.25
Scots 4.29
Germans 4.25
USA 4.25
Irish 4.23
American Indians 4.23
Italians 4.00
While the ranks are similar for the two sexes, Irish men rank a little higher than the women, while Scottish and English women rank higher than their male counterparts. Dragging your partner to church might be one factor that makes men and women similar. Another is selecting someone like yourself for a partner.
Notice how the least religious women (Italians) are more churchgoing than the most religious men (Blacks).
Friday, November 10, 2006
More on spirituality: I just posted on the topic of ethnicity and feeling connection to all life, and it made me wonder how much of an overlap there is between spirituality and church attendance. According to GSS data on 1,271 people, the correlation between the two is .27. Note that, as a rule, correlations based on survey data are disappointingly low, so relatively speaking, this ain't too shabby. Here is the list of mean church attendance by ethnic group (3=several times per year, 4=once a month):
Mean church attendance score
Blacks 4.44
Mexicans 4.22
Irish 3.97
USA 3.93
Germans 3.92
English/Welsh 3.87
Scandanavians 3.86
Scots 3.77
Italians 3.71
American Indians 3.70
East Asians 3.58
Across the 10 groups, the rank correlation (Spearman's rho) for spirituality and church attendance is .32. Certain groups lower the correlation: the Irish are church-goers but are not spiritual, and Scots and American Indians are spiritual but don't go to church much.
Update: On a related topic, what is the distribution of church membership among American Indians? Three-quarters are Protestant, 9 percent are Catholic, 11 percent have no religion, and only .6 percent report a Native American faith.
Which American ethnic group is the most spiritual? GSS respondents were asked how often do they experience a connection to all life. Answers range from never (=6) to many times a day (=1) (many times a day?!) I calculated mean scores for ethnic groups with at least 30 cases and subtracted this number from 6 so that higher numbers indicate greater spirituality:
Mean spirituality score (sample size in parentheses):
Scots 3.29 (42)
Blacks 3.26 (82)
American Indians 3.12 (58)
USA 3.04 (1,000)
English/Welsh 2.95 (137)
Mexicans 2.91 (61)
Germans 2.90 (151)
Irish 2.90 (138)
Italians 2.80 (54)
Scandanavians (Danes, Norwegians, Swedes) 2.78 (36)
East Asians (Chinese, Japanese, Filipinos) 1.92 (26)
I was under the impression that Scandanavians and East Asians were sober people, so I combined national groups so samples were larger. I was right, espeically with Asians: they fall to the bottom of the list. Blacks in second place seems right: they are not a sober people. The Scots in first place does seem odd, however.
Tuesday, November 07, 2006
Who has the most good friends? I was interested to know which American ethnic groups say they have the most close friends. According to the General Social Survey, this is the mean number reported:
Mean number of close friends (sample sizes in parentheses):
Norwegians 12.7 (32)
Scandanavians 9.7 (60)
Germans 7.8 (198)
English/Welsh 7.7 (198)
Mexicans 7.4 (38)
USA 7.2
American Indians 7.2 (43)
Irish 6.9 (167)
Poles 6.2 (54)
Blacks 6.1 (91)
Italians 5.0 (75)
This is not the pattern I expected. Comments?
Saturday, November 04, 2006
Mexican women second most concerned about women's rights: Americans were asked by the General Social Survey (GSS) how important women's rights were to them. Answers ranged from "not at all" (=4) to "one of the most important issues" (=1). I calculated the means for women from ethnic groups with sufficiently large samples. I subtracted the means from 4 so that higher numbers indicate greater feminism. Here they are:
Mean feminist score
Blacks 1.94
Mexicans 1.91
American Indians 1.83
Italians 1.82
Germans 1.70
Irish 1.74
English/Welsh 1.58
It is interesting that the women from the most gender-traditional ethnic groups are the ones most concerned about women's issues. There are at least a couple possible reasons for this: 1) these groups are poorer and more liberal, and feminism goes with liberalism; and 2) these groups have the worst behaving men.
But I thought Mexican women were paragons of traditional family values? These women may not be advanced feminists of the you-must-be-a-lesbian-to-be-liberated type, but evidently they won't be voting in sync with Focus on the Family.
Subscribe to:
Posts (Atom)
Are gun owners mentally ill?
Some anti-gun people think owning a gun is a sign of some kind of mental abnormality. According to General Social Survey data, gun owners ...

-
 In the comments in the last post , some readers contended that Jews are not ethnocentric. Using the same question I used in the comments se...
 -
Via a reader at iSteve, it looks like this might be the vocabulary test used by the General Social Survey. (Someone please tell me if I'...
-
I've been distributing a questionnaire to students which, among other things, asks them their religion. Quite a few have answered "...